Quantcast
Channel: modeling the CNW in Milwaukee, 1957
Viewing all 116 articles
Browse latest View live

Cement Flows Part 2: The Wisconsin Scene

$
0
0
In an earlier post (http://cnwmodeling.blogspot.com/2013/12/commodity-flows-of-portland-cement.html)  Brad Andonian and I looked at the commodity flow of portland cement with a focus on the eastern U.S., particularly Pennsylvania and the New York metropolitan area.  We found (nationally) that the portland cement commodity flow was strong throughout the 1950s, that both special cars and ordinary general service box cars were involved, and that there was a strong regional character to the individual commodity flows.  After reading this post, Andy Laurent suggested taking a look at the commodity flows of portland cement around Wisconsin.  These commodity flows are important to both of our layout settings as well as intrinsically interesting [in my view ;) ], so that's what Andy and I are going to do in this post.


The Relevant Data:

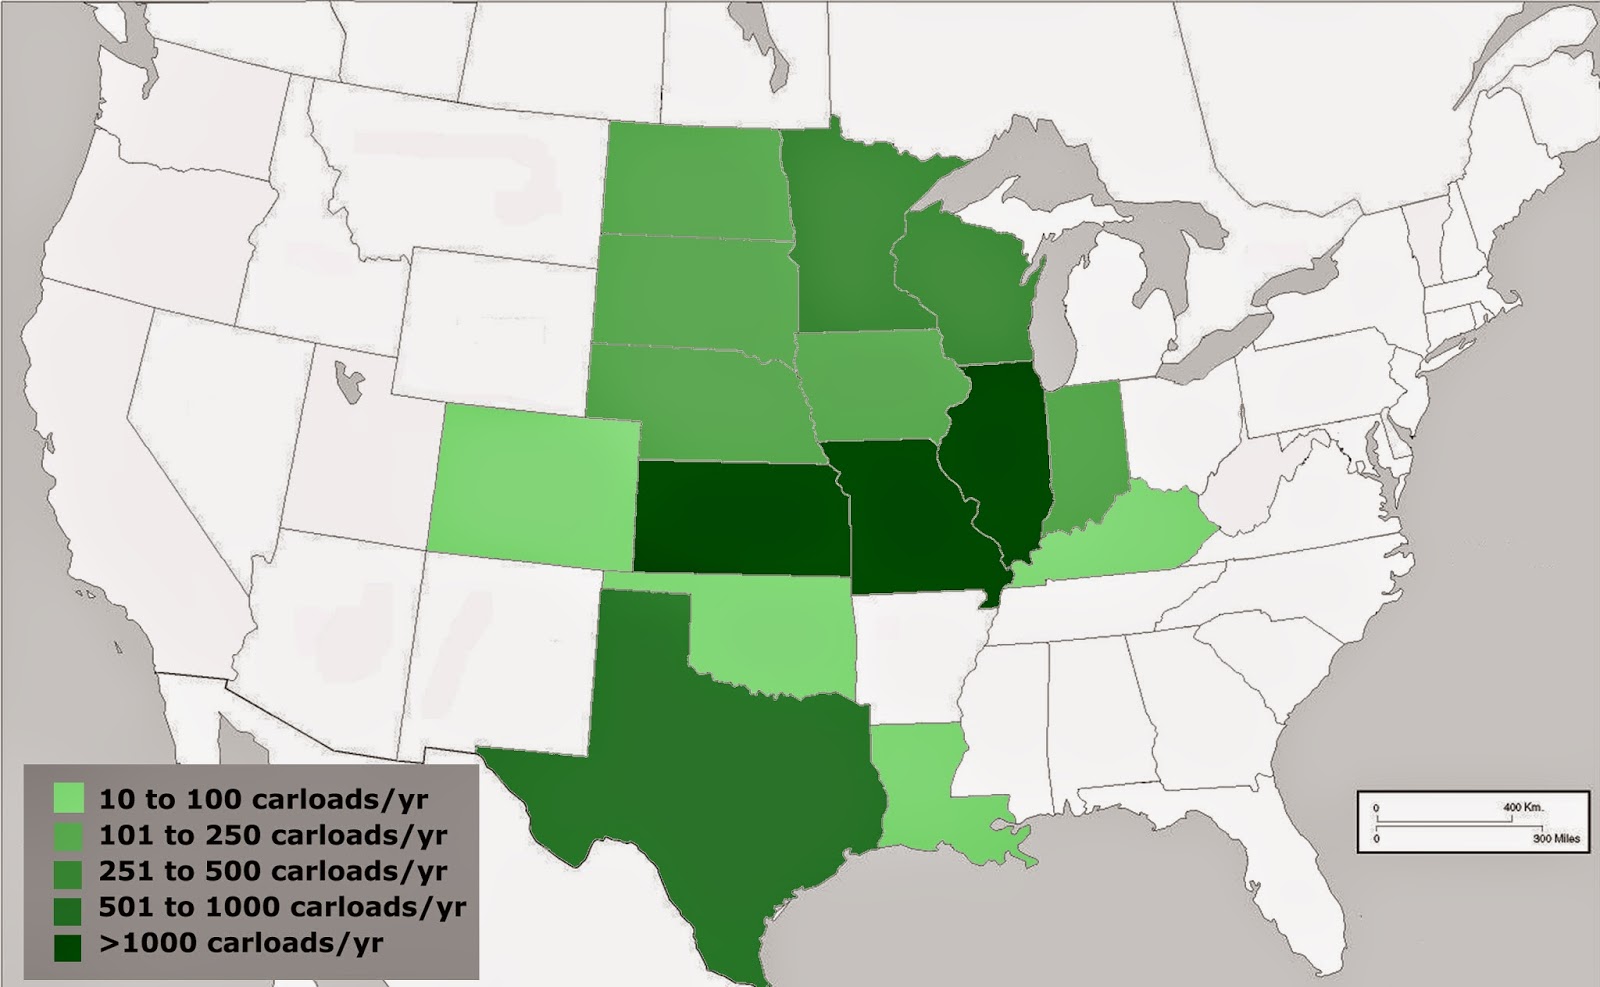
The data from the 1% carload waybill survey during the 1950s (1950 through 1960 inclusive) show that Wisconsin was a net importer of portland cement.  Extrapolating from the 1% sample, each year, roughly 10,000 carloads of cement entered Wisconsin, roughly 1,000 carloads of cement left Wisconsin for other states, and roughly 1,500 carloads was distributed within the state (Wisconsin - Wisconsin).  The weight, distance, and revenue data for these Wisconsin shipments were not significantly different national averages.

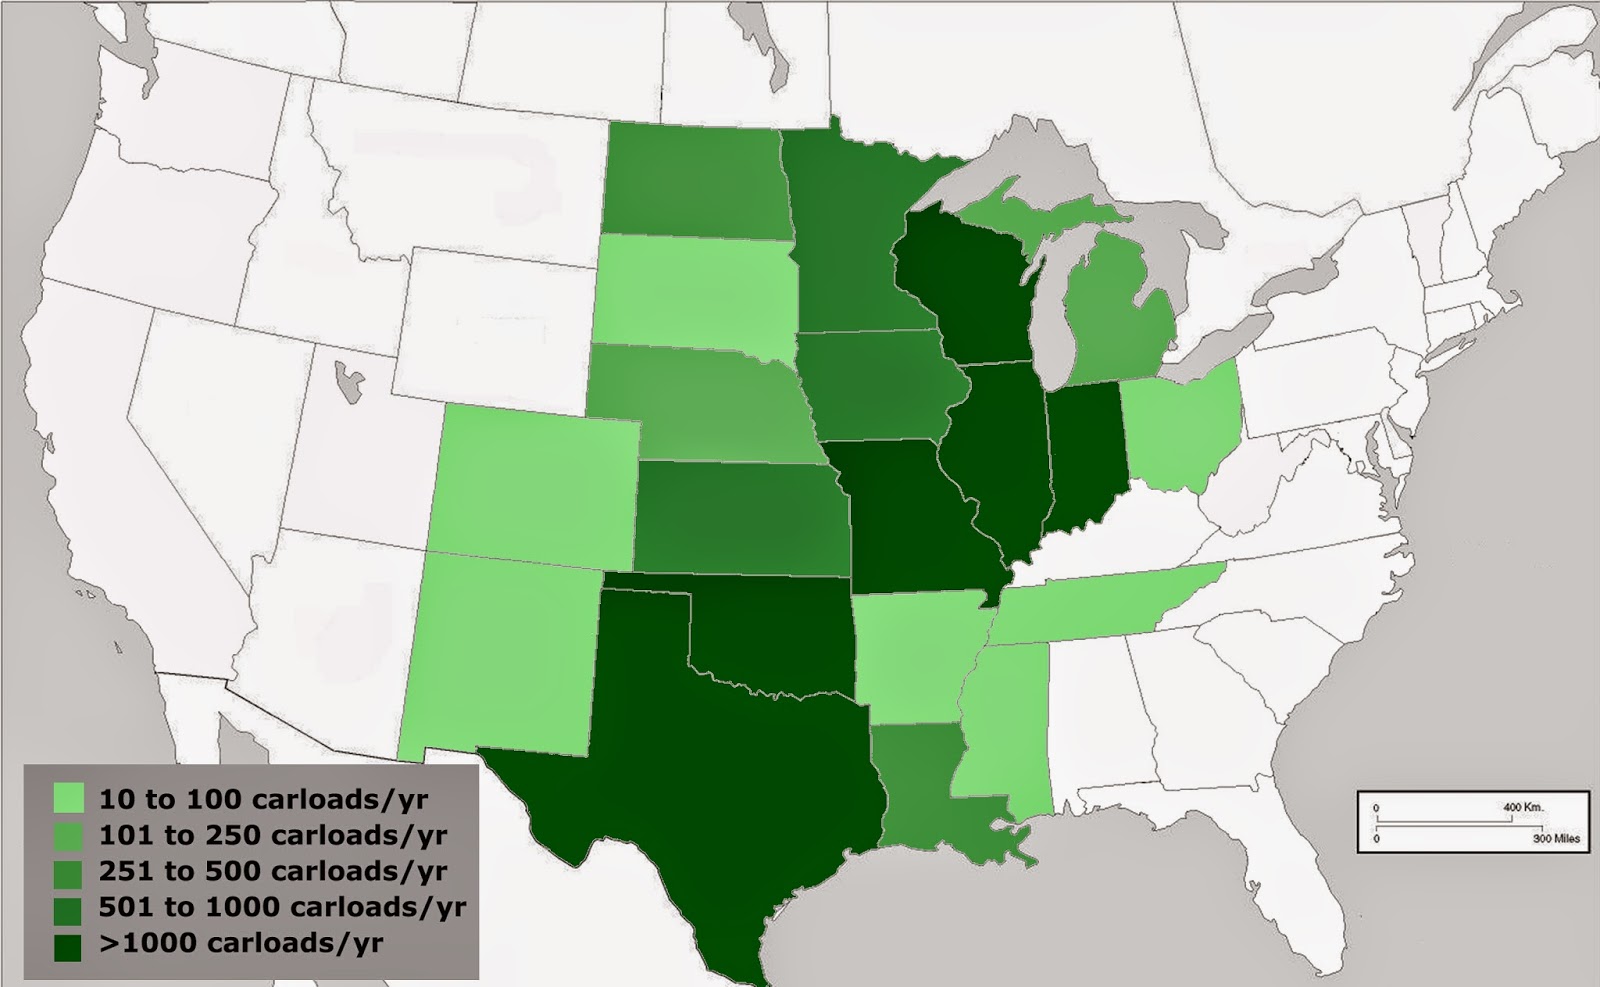
Interestingly, the data do show a temporal (secular) variation.  The period from 1950 through 1955 is strongly different that the period from 1956 through 1960.  This table shows the average carloads entering Wisconsin from other states during the two time periods:


To Wisc.Carloads/Yr
From:<50-55><56-60>
Georgia020
Illinois70833940
Indiana68340
Iowa17832560
Kansas50120
Michigan2171160
Minnesota783780
Missouri10040
Ohio020
Oklahoma020
Pennsylvania83360
total107839060


Note the decrease in the Illinois to Wisconsin traffic and the increase in the Iowa and Michigan flows to Wisconsin.  The sampling error in these averages is on the order of a few tens of carloads per year.  The following table shows the same information for the average number of carloads leaving Wisconsin for other states:


From Wisc.Carloads/Yr
To:<50-55><56-60>
Illinois080
Michigan183420
Minnesota800740
Nebraska020
North Dakota200420
total11831680


And finally, for traffic both originating and terminating in Wisconsin:


Internal Distribution4502520

In the previous post I remarked that Schenker's data for the Port of Milwaukee in 1963 showed the rough equivalent of 7,500 carloads received through the Port via bulk freighter; 1,200 carloads received via car ferry from Michigan (and other points eastward); and 3 carloads shipped via car ferry to Michigan (and possibly other points eastward).  These numbers are roughly consistent with the average of the 1% survey from the second half of the 1950s (if you accept the thought that a lot of the inbound bulk freighter traffic was moved out of the ports via truck rather than rail) except for the Wisconsin to Michigan flow.  The 1% survey says maybe 420 carloads per year and Schenker's data says maybe 3 carloads via car ferry from Milwaukee.  Is the "missing" rail traffic from Wisconsin to Michigan from the Manitowoc or Kewaunee ferries?  Sent south through Chicago and around Lake Michigan?  More likely, its the result of redistribution (transshipment) and that's an interesting part of the story that I think is directly relevant to Andy's setting (Green Bay).  We'll revisit this topic a bit later in this post.


A Brief Tour of Selected Facilities:

In this part of the post, we look at some of the larger cement-related facilities near Lake Michigan and Lake Superior, working from Racine north to Superior (and as an added bonus, one in Duluth).  Descriptive information is at the bottom of each aerial photo.  The facility names are all taken from City Directories dating from 1957 through 1959.  You can click on each photo to enlarge or download.


Facility Name: Consumers Co.
Location: 3 Mile Road, just north of Racine, a couple of miles inland from Lake Michigan
Date of Photo: April 9, 1955
Description: CNW's Chicago to Milwaukee double track main to west of photo (Old Line Subdivision).  This is a ready-mix concrete plant.  Note that this is NOT a cement manufacturing facility; it turns out there is no source of cement-quality limestone or dolomite nearby and clearly there are no kilns for cement production.  Instead, aggregate is mined from the open pit and combined with cement brought in by rail (note cement silos on rail siding highlighted in blue and the two dark-colored LOs on the rail siding south of the silos).  Mixed wet concrete leaves via truck.  Mined aggregate also leaves via rail (note long string of hoppers on siding leading to aggregate loader.
Example Commodity Flows: Consignee for portland cement shipped from Milwaukee port terminals, originating line-haul carrier MILW, via CNW (Old Line, interchange at Jones Island or National Yard); consignee for portland cement shipped from various northern Illinois cement plants, originating line haul carrier probably CNW if shipment originated within Chicago switching district.  Shipper for rock and sand to various nearby locations.


Facility Name:  Huron Portland Cement Co. (bottom) and Manitowoc Portland Cement Co. (top)
Location:  Port of Milwaukee, Burnham Canal
Date of Photo:  April 8, 1955
Description:  Cargill's Elevator E on the Milwaukee Road is to north (right) of photo.  These are both marine transshipment facilities.  Cement is unloaded from lake boats and stored in the tall, cylindrical silos.  The cement is loaded from the silos into rail cars and trucks as needed.
Example Commodity Flows:  Shipper for portland cement, originating line-haul carrier MILW.


Facility Name:  Penn-Dixie Cement Corp.
Location:  Port of Milwaukee, Burnham Canal
Date of Photo:  April 8, 1955
Description:  This facility is across (south) of the Burnham Canal from the facilities shown above.  This is another marine transshipment facility, with an adjacent warehouse for bagging cement.  The facility is served by the Milwaukee Road and truck.
Example Commodity Flows:  Shipper for portland cement, originating line-haul carrier MILW.  


Facility Name:  Universal Atlas Cement Co.
Location:  Port of Milwaukee, North Menominee Canal
Date of Photo:  April 8, 1955
Description:  This facility is several blocks north of the Burnham Canal.  This is another marine transshipment facility, with an adjacent warehouse for bagging cement.  The facility is served by the Milwaukee Road and truck.
Example Commodity Flows:  Shipper for portland cement, originating line-haul carrier MILW.  


Facility Name:  Kolinski Concrete Co.
Location:  Port of Milwaukee, Kinnikinnic River
Date of Photo:  April 8, 1955
Description:  This facility is on the south side of the Kinnikinnic River near the Kinnikinnic Ave. bridge.  It is just across the river from the Maple Street Ferry Dock.  Note the lake boat - it is a little bit to long for any of the 1955-era cement carriers, so it was probably unloading aggregate.  Both cement and aggregate are unloaded here and ready-mix cement is the primary product shipped.  The Milwaukee Road's lead into the Jones Island switching area is on an elevated trestle on the left hand side of the photo.  The railcar unloading facility is a dump pit that leads to a conveyor into the aggregate piles.  This siding and dump pit is just to the right of the elevated trestle and connects with that track off the bottom of the photo.
Example Commodity Flows:  Consignee for sand and rock, originating line-haul carrier would be any carrier in the area.  

I visited this area in 2012 and took these two photos from the bridge.  The first is of the St. Marys Conquest; a post steam era cement carrier, and the second is of the facility itself:


Her sister ship, the St. Mary's Challenger made her last run in October and is being sent to Sturgeon Bay for conversion to an integrated barge/tug.  Perhaps the last freight steamer on the lakes with reciprocating engines (and featured on this year's Chicago South Shore & South Bend Railroad's Christmas card!).


Facility Name:  Northern Milwaukee Lime and Cement Co.
Location:  Milwaukee, Silver Spring Road
Date of Photo:  April 12, 1954
Description:  This is a small facility on the north side of Milwaukee.  The Milwaukee Road's station North Milwaukee is just to the north, where the Beer Line diverges to the east from the main.  Cement was probably trucked to this location from one of the Port of Milwaukee facilities discussed above.  That circular feature is not a pit mine - its an aggregate unloading area for rail cars (note the eight open-top hoppers on the loading siding).  Most of the ready-mix concrete is probably shipped by truck.
Example Commodity Flows:  Consignee for aggregate, originating line-haul carrier would be any local carrier.  

To be continued next post…


Wisconsin Cement Flows (Continued)

$
0
0
This post continues the previous post on the commodity flows of portland cement in Wisconsin in the 1950s.  In the previous post we looked at several facilities in Racine and Milwaukee.  We'll pick up with a tour of selected facilities near the lakefront, starting in Manitowoc and working northwest.  Captions are at the bottom of each photo, and facility names are from City Directories dating from 1957 through 1959.


Facility Name:  Manitowoc Portland Cement Co.
Location:  Manitowoc River, northwest of downtown Manitowoc
Date of Photo:  May 8, 1951
Description:  The area shaded in blue is the Manitowoc Portland Cement Co.  This facility actually produced cement on site; it is not a storage and transshipment facility.  The kilns are in the long horizontal building indicated by the blue arrow.  Note the large piles of coal, probably mostly delivered by lake boat; also the large piles of limestone/dolomite just to the north of the coal piles and the bridge crane for unloading lake boats.  Limestone and coal were shipped into the facility by lake boat, and the cement was produced on site, stored in the vertical silos just above the coal pile, and subsequently shipped by rail and truck.  The facility was served by the SOO and the CNW - the CNW yard serving industries in the area is in the north (top) of the blue shaded area.  


I couldn't resist including Manitowoc Shipbuilding Inc. in this crop.  It is on the peninsula just to the right (east) of Manitowoc Portland Cement Co.  Over 400 hulls were erected at this facility over the years, including the City of Midland, several other cross-lake car ferries, a number of bulk carriers, and several cement carriers.  Two Ann Arbor/Grand Trunk ferries are shaded in green; the one to the left is in the floating dry dock.  The boat highlighted in yellow is the John G. Munson, a 650-foot self-unloader that was commissioned in August of 1952.  The keel was laid on March 7, so in this view just part of the hull, the bow, and stern have been erected.  

Example Commodity Flows:  This facility was probably an infrequent consignee for car loads of coal and limestone; more frequently a consignee for gypsum and coal ash (ingredients in portland cement), and most often a shipper of portland cement.  I haven't been able to find any evidence that there was a bagging area associated with the facility, so I think most of the cement was shipped in bulk by truck and rail (in covered hoppers).  


Facility Name:  Universal Atlas Cement Co. and Western Lime and Cement Co.  
Location:  west side of Fox River, Green Bay
Date of Photo:  April 17, 1971
Description:  The area shaded in blue is the Universal Atlas Cement Co.  This facility was a storage and transshipment facility.  Note the riverfront structures for accepting deliveries from the cement carriers and the large vertical silos.  Its hard to tell from the aerial photo and the Sanborn maps, but there is either a very small bag house or none at all.  The facility shaded in yellow is Western Lime & Cement Co., with 5 horizontal kilns.  This is a lime and cement manufacturing plant.  Limestone/dolomite and coal were delivered by lake boat at the riverfront, and the lime and cement were shipped by truck and rail.  

Example Commodity Flows:  The Universal Atlas Cement Co. was a rail shipper of portland cement in bulk.  The CNW and the GBW were originating line-haul carriers.  The Western Lime and Cement Co. might have been an infrequent consignee for car loads of coal and limestone to supplement boat deliveries; was probably a consignee for gypsum and coal ash (ingredients in portland cement), and possibly a shipper of bagged portland cement and lime - it appears that there might have been a loading platform on the west (left) side of the building but it is really hard to tell from the aerials and Sanborn maps.  


Facility Name:  Huron Portland Cement Co. 
Location:  west side of Fox River at the foot of 9th Street, Green Bay
Date of Photo:  April 17, 1971
Description:  The area shaded in blue is the Huron Portland Cement Co.  Like the Universal Atlas facility shown above, this was a storage and transshipment facility but with a large bag house.  Note the rectangular cluster of vertical silos.  

Example Commodity Flows:  Huron Portland Cement Co. was a shipper of portland cement, both in bulk and bagged.  The facility was served by the Milwaukee Road.  


Facility Name:  Huron Portland Cement Co. 
Location:  outer harbor, Superior Wisc.
Date of Photo:  May 2, 1952
Description:  The area shaded in blue is the Huron Portland Cement Co.  in Superior's outer harbor.  This was a storage and transshipment facility as well as a manufacturer of ready mix-concrete.  Aggregate and portland cement were shipped by lake boat.  
Example Commodity Flows:  Huron Portland Cement Co. was a shipper of portland cement.  The facility was served by the Soo Line.    


Facility Name:  Universal Atlas Cement Co. 
Location:  inner harbor, Duluth Minn.
Date of Photo:  May 2, 1952
Description:  The area shaded in blue is the Universal Atlas Cement Co.  Note the four large silos underneath the cross-shaped roof at the bottom end of the pier.  This was a storage and transshipment facility.  
Example Commodity Flows:  This facility was a shipper of portland cement.  The facility was served by the CNW.  The CMO Freight House is immediately north (above) the facility.


The Cement Carriers:


Cement was undoubtedly carried in some of the ordinary bulk carriers (straight deckers and self unloaders) when necessary.  However, because of the greater density, sensitivity to moisture, and limited number of distribution routes, specialized lake boats were developed in the early 1920s for marine shipment of portland cement on the Great Lakes, and by the 1950s the cement carrying fleet was undergoing a second round of expansion and upgrading.  These cement carriers were self-unloaders; they needed no overhead cranes or bridges on shore to unload.  They only needed to be able to connect their pressurized hoses to pipes that lead to the storage silos.  In 1957 there were 9 of these vessels that could be found around Lake Michigan and Lake Superior waterfronts:


VesselLength (ft)Beam (ft)Ref.
John W. Boardman34955      a
BulKarrier25343      b
Cement Karrier25343      b
S. T. Crapo39360           c
E. M. Ford40650      d
J. B. John25043      e
Daniel McCool14733      f
Samuel Mitchell29840      g
Paul H. Townsend42950      h


The BulKarrier and the Cement Karrier were of Canadian registry, all others were registered by U.S. fleets.  Note that these boats are much shorter than the typical straight decker or self unloading bulk freighter (which in the 1950s was around 600 to 700 feet in length).  If constructed in HO scale the cement carriers would range from 20 to 59 inches long and about 6 inches wide.  

This photo of the S. T. Crapo in Lake Huron illustrates the lines of a loaded cement carrier in the classic 1950's Huron Cement scheme:


The Freight Cars (Particularly the Covered Hoppers):

In an earlier post I showed data from the 1% carload waybill study that indicated on a nationwide basis that a little more than half of the carloads of portland cement shipped in 1957 were in freight cars of type L (special).  Except on the east coast (Pennsylvania, New Jersey, and New York), where a small and interesting fleet of container gondolas operated (LG) the freight traffic in portland cement was divided between ordinary general service box cars and covered hoppers cars (LOs).  I've written a lot about the problem of general service freight car distribution, so for the remainder of this post I want to consider the LO fleet and how one might go about selecting covered hoppers to handle portland cement commodity flows in the context of Wisconsin.  

In the January 1958 ORER there were 2,271,377 total freight cars listed in 15,785 items by U.S. carriers and private owners.  The average number of freight cars per item was about 144.  Of the total fleet, 60,883 were classified as type LO, amounting to about 2.7%.  These cars were distributed among 633 separate items, with an average of about 96 cars per item.  

The typical LO carrying cement was:
  • owned by a rail carrier rather than a private car owner
  • in dedicated service, rather than a "free-roller"
  • returned empty via service route rather than loaded off-line to some other destination
  • either a Pullman-Standard PS-2 (with frequency about 30%) or an ACF 1958 cu. ft. LO (with frequency about 60%).
Fortunately high quality versions of both of the most frequently used cars are readily available in HO:

and there is an abundance of literature on the production, rosters, and paint and lettering available, e.g.:
Hawkins on the ACF 1958 cu ft. LO  (first of a six part article, all available on line)


So the main problem for the modeler aspiring to replicated the flows of portland cement in bulk is the selection of prototypes.  Here's how I reasoned it out for my layout setting, the Jones Island area of Milwaukee.  Its important to remember that the Port of Milwaukee had two car ferry slips.  The Jones Island Municipal Ferry Terminal (which is on my layout) was switched by the CNW and received cars for the CNW and its connections.  Cars for the Milwaukee Road, Soo Line, and their connections were more likely to be associated with the Maple Street ferry slip, which is not on my layout.  (The CNW, MILW, GTW, and SOO did use the Jones Island yard as an interchange point).  Also, the major portland cement terminals were served by the Milwaukee Road.  So to appear on my layout, a load of portland cement in a covered hopper could be:
  1. inbound from the CO and its connections via ferry (from Ludington) for some destination on the CNW
  2. inbound from the GTW via ferry (from Muskegon) and interchanged for some destination on the CNW
  3. outbound from one the Milwaukee area cement terminals (which were served by the Milwaukee Road) and interchanged for some destination on the CNW

This suggests to me that C&O, MILW, and GTW are the LOs that will most frequently pass through the Jones Island area, and these carriers all depended on ACF a bit more than on PS in 1957.  So it looks like finding a good source of the Intermountain ACF cars should be on my list of things to do before they disappear, like so many of the other styrene kits have…

In our correspondence about this post Andy brought up two ideas about selecting prototype LO cars.  He remarked that he plans to have a "healthy fleet of private marks", which I hadn't considered.  It seems quite possible to me that a large company like Penn-Dixie or Huron could have leased some SHPX cars for example, and assigned them to specific operations or facilities.  Long-term lessors did not always label the cars for the lessees, and there is something a little different about the operation with the anonymity of a fleet of assigned cars from a private car owner.

The other concept he brought up is the idea of a pool of cars from a variety of different carriers (not just the carrier serving the facility) assigned to an operation.  This is analogous to the way that some auto parts pools were organized.  In this scheme, a bigger facility, say the Universal Atlas Cement Co. in Milwaukee, which is served by the Milwaukee Road, might have a pool of MILW, SOO, CNW, and GBW cars assigned to dedicated service.  The proportion of each carrier's car would be negotiated among the carriers according to the expected traffic distribution, but the cars would all be assigned to the pool and loaded to any destination covered by the pool regardless of road name.  

Charles Hostetler and Andy Laurent

A Prototype Waybill - 34

$
0
0
Introduction:

This post starts the discussion of the waybills for the August 29, 1962 Ahnapee & Western train.  There were 15 cars in this delivery from the Kewaunee, Green Bay & Western via the interchange at Casco Junction.  Trains averaged about 15 cars on the A&W in the early 1950s, and probably a bit fewer in 1962; but not during cherry season - the late summer months continued to be well trafficked.  August 29 had quite an interesting variety of shipments, including some of the more typical (traffic lane) deliveries as well as some extremely rare shipments.  All of the scans are provided by Andy Laurent from the A&W waybill collection.  None have been previously published.

The shipment that is the subject of this post was one of the extremely rare shipments.  It was a "doublet" that involved two freight cars with two sets of nearly identical waybills.  The waybill collection actually contains 7 pieces of paperwork for this two-car shipment.

The first piece of paper is the original waybill that travelled with one of the cars (click to enlarge):


The second is a letter from the consignee to the A&W agent regarding delivery details for that shipment:


The third and fourth are additional waybill forms for the first car, filled out by hand (rather than by typewriter).  They were used solely to record the icing charges for the shipment.  The A&W agent needed these to send out the freight bills (the shipment was sent collect).  Judging from the interchange stamps these waybills must have accompanied the car for at least part of the journey.  They might have been mailed from Canada to the agent at Frankfort or Kewaunee and joined the shipment en route.


A similar paperwork trail accompanied the second car in the shipment:


Relationships to Other A&W Waybills:

There are 326 waybills in the spreadsheet that Andy prepared that are shown on the GBW waybill page (http://www.greenbayroute.com/1962ahwwaybills.htm) covering the time period June 27, 1962 to August 27, 1962.  In addition to selected examples of those waybills, we've subsequently examined about 10 more from the August 28th train.  None of the waybills we have examined so far are related to these two.


Format:

The originating line-haul carrier was the Canadian National Railways.  There are actually two different forms involved.  The original typed waybills are on a CN form labeled "Freight Waybill - Preferred Movement" while the hand-written waybills are on a simple Freight Waybill form.  All of these are full-sized 8 1/2 by 11 inch forms with a center-line fold.  Note that the headers are centered on the forms, rather than the more typical right-justification.  All of the footers are centered as well, which was typical.  The earliest forms date from April 1959.  Andy reported that the typewritten waybills are definitely on pink stock; the thin paper and white backing he used for the scan washes out the color for a bit, but thees preferred movement waybills followed the common practice of using pink stock to help them stand out from the rest of the stack.


Typefaces, Preprinting, Stamps, and Handwriting:

The two typed waybills were prepared on different typewriters.  Both typefaces are san serif, moderately condensed, and have old-style numerals.  The typeface on the first waybill has open-top fours and is a bit heavier, while the typeface on the second waybill has closed-top fours and is a bit lighter and taller.

There is no preprinting on any of the waybills.

The typical interchange (rectangular) and yard arrival stamps (circular) are present in profusion.  There are also a variety of stamps associated with customs at the Canadian-U.S. border.  Both of the typed waybills also have a stamp that was applied by the Ann Arbor at Frankfort, Mich. when the cars were iced.  This stamp has spaces for the date of icing and the amounts of ice and salt that were used.  There are also CN icing stamps on the back that show through in places.  It appears that the bunkers were nearly empty as 6,500 lbs of ice (the full capacity) were noted as added.

On the typed waybills, aside from several miscellaneous notations, there were three instances of handwriting.  The first was associated with the change in consignee from Miller Distributing Co. to Fruit Growers Coop.  The new consignee was inserted by hand.  The second and third instances were completion of the appropriate parts of the weight ticket (by the CN in Toronto) and the icing stamp (by the AA in Frankfort).

The three hand-written waybills must have accompanied the shipment for at least part of the way; judging from the junctions stamps these forms were joined with the shipment at least some time before it arrived in Kewaunee.  They appear to have been used to as a supplementary record of the amount and cost of ice and salt used in icing.  A reasonable guess is that these CN forms originated when the cars were iced in Montreal and Toronto.


Dates and Waybill Numbers:

The waybill numbers for the typed waybills are consecutive, but the waybill dates are several days apart (August 23 and 25).  The waybill numbers for the hand-written waybill supplements are from a quite different series than the waybill numbers for the typed waybills.

It was hard for me to understand the eastern portion of the trip (from Chicoutimi to Mimico Yard in Toronto), but my best reconstruction of the shipment from August 26 forward is:
August 26:  Mimico Yard on the CN; Sarnia Tunnel on the CN
August 27:  Port Huron Mich. on the GTW
August 28:  Durand Mich., where the shipment was interchanged from the GTW to the AA; later iced on the AA in Frankfort
August 29:  Kewaunee on the GBW and arrival in Sturgeon Bay.


The Cars:

The cars were CN 210623 and CN 211390.  Both were refrigerator cars (RAMH; refrigerator cars with brine tanks, equipped with beef rails, having special heating appliances for the protection of commodities against freezing).  From the Jan. 1958 ORER:

CN 210300 to 210899; Steel refrigerator cars, overhead ice tanks; 587 total
IL:  40'
IW:  8' 6"
IH:  6' 8"
EL:  42'
EW:  10' 4"
EH:  15' 8"
Door Openings:  5' by 6' 9"
Capy:  2273 cu. ft.; 105,000 lbs

CN 210900 to 211399; Steel refrigerator cars, overhead ice tanks; 494 total
IL:  40'
IW:  8' 6"
IH:  6' 8"
EL:  42'
EW:  10' 4"
EH:  15' 8"
Door Openings:  5' by 6' 9"
Capy:  2273 cu. ft.; 105,000 lbs

Both types held 6,500 lbs. of crushed ice in overhead bunkers.

These are two of the Canadian 8-hatch overhead brine tank refrigerator cars:
http://freight.railfan.ca/cgi-bin/image.pl?o=cn&i=cn210431
http://freight.railfan.ca/cgi-bin/image.pl?i=cn210431_2&o=cn  (The date supplied for these first two photos is clearly in error; they were taken in the early 1960s, not 1953. The CN wet noodle logo dates from December 1960/early 1961)
http://freight.railfan.ca/cgi-bin/image.pl?i=cn211349&o=cn
http://freight.railfan.ca/cgi-bin/image.pl?i=cn211284&o=cn
http://freight.railfan.ca/cgi-bin/image.pl?i=cn211660&o=cn  (This is the P/L scheme I'm interested in for a fall 1957 layout setting)
http://freight.railfan.ca/cgi-bin/image.pl?i=cn209712&o=cn

In HO, the obvious approach to open-the-box and weather modeling is the True Line Trains 8-Hatch reefer:
http://www.truelinetrains.ca/freight-cars/ho---8-hatch-reefer

Also in HO, Funaro and Camerlengo makes a resin kit in several versions:
http://www.fandckits.com/HOFreight/5130.html
http://www.fandckits.com/HOFreight/5131.html
http://www.fandckits.com/HOFreight/5132.html


The Shipper:

The shipper was Saguenay Mercantile Ltd., in Chicoutimi Quebec.  Saquenay Mercantile was a produce commission broker that was incorporated in 1949.  I haven't been able to find out much about them except that at some time in the 1950s they found a 24-inch snake in their warehouse (see second picture from the top at http://translate.google.com/translate?hl=en&sl=fr&u=http://www.shistoriquesaguenay.com/PhotoDescr.asp%3FTxtPhoto%3Dchicoutimi%26offset%3D4270&prev=/search%3Fq%3D%2522saguenay%2Bmercantile%2522%2Bchicoutimi%2Bquebec%26client%3Dsafari%26rls%3Den%26biw%3D1436%26bih%3D790), and that they were located at 538 rue La Fontaine in Chicoutimi, which was not really close to the CN rails.  Quite possible the blueberries were loaded into the reefers at a house track near the depot (http://www.panoramio.com/photo/33445078).


The Consignee:

The consignee was Miller Distributing Co., Inc.  They had a cold storage warehouse and shipping facility in Marshfield, Wisc. served by the C&NW, but they must have had some business dealings with the Fruit Growers Coop in Sturgeon Bay because that is where they directed the agent to deliver the car.  The Fruit Growers Coop was a canning facility in Sturgeon Bay (on the east side of the bay, south of the bridge; inside the green outline) that was served by the A&W:

The Fruit Growers Coop had received two cars in August just prior to this shipment that were recorded in the A&W collection.  On August 1 they received a carload of empty cans and on August 28 they received an empty "DF" car for loading.  So this was a pretty busy season for that facility, and I expect to see more activity from this facility as we examine additional trains.


The Route:

The car originated on the CN near the eastern end of the Saguenay branch line in northeastern Quebec. The route was:

CN - PORT HURON TUNNEL - GTW - DURAND - AA - KEWAUNEE - KGB - CASCO JUNCTION - AW - STURGEON BAY.

The car cleared customs in Port Huron, Mich.  I calculated the short-line haul as:

CN:      741 miles
GTW:    83 miles
AA:     257 miles (including 60 miles on the ferry)
KGB:    13 miles
AW:      34 miles

Total: 1,128 miles


The Commodity:

The commodity was fresh blueberries.  There were in ICC Commodity Class 053:  Berries Fresh, Not Frozen.  These blueberries were almost certainly destined to be used in a canned fruit product of some kind (not for local consumption).  This makes the commodity lane a rare one for most modelers (unless it is overhead traffic).  Griffin-Touhey was in the business of making canned fruit cocktail (they were open year-round), so that would be a best guess of their final use.  However, the change of consignee to Fruit Growers could have been for warehouse capacity considerations (FG held it for Miller?)...or perhaps Fruit Growers was canning something other than just pie cherries that summer?

Both cars held 1512 boxes, the weight per box was 27 lbs., so the total billed weight was 40824 lbs.  The shipping charges were 202 per cwt., so each car cost 824.64 in shipping.  By the time ice and salt were added to the bill it came to 984.35 for each car!  Note from the actual weight tickets the net weights of the shipment were 51,240 lbs. and 47,700 lbs., so the weight agreement must have had some allowance for the empty boxes.

As measured by the 1% Carload Waybill Sample shipments in ICC commodity Class 053 were extremely rare in the late 1940s and 1950s:

YearCarloads<Ton/Car><Haul/Car><Rev/Car>
19476211,051385
19482312,5121,026
1949----
195013124661077
195119302233
1952----
1953----
1954----
1955----
1956----
195715357216
1958----
1959----
1960----
Those listed in the table above were domestic shipments, originating largely in Oregon.  In the special study of commodities originating in Canada (data from 1951 through 1953) we find Canadian shipments to the U.S. were more common than U.S. shipments to U.S. destinations during that time period.  The three-year sample recorded 4 shipments to Illinois, 2 to Minnesota, and 1 to New York.  

If we make a VERY rough overestimate of 3 shipments of ICC 053 per year, this suggests that the average frequency of carload berry shipments is about 1 per 100,000 carloads.  So if your local layout setting permits, this is an opportunity to feature a vary rare commodity flow with a pretty cool Canadian freight car.  If your local industries do not include a fruit cannery, this commodity flow is probably best modeled as a rare example of through (overhead) traffic.  

In my layout setting, I use the Port of Milwaukee data as a primary mechanism to model commodity flows.  His data tables do not show any domestic interlake traffic in fresh berries (i.e., shipments via car ferry).  Five tons of fruits and berries were exported overseas through the Port, mostly through Transit Shed 1 (which is on my layout), and that might have been a single delivery made by rail.  For my purposes I put this commodity flow in the little stack of oddities and curiosities that I select with a frequency such that it would appear randomly once in every several hundred operating sessions.  


Special Instructions:

I thought it was interesting that the cars were directed to be weighed.  They were loaded and billed by Shippers Load and Count, but someone must have wanted the actual weights for some other purpose.  

I also thought it was interesting that the cars were directed to be re-iced to capacity at every icing station.  The charges for the ice and salt amounted to more than 10% of the total shipping cost.  Note that the crushed ice/salt mixture was specified to be 30% salt.  


Freight Car Distribution:

Even though carrier-owned, these refrigerator cars were managed on a mileage basis.  The considerations of the Code of Car Service Rules and the Code of Per Diem Rules weren't applicable to these shipments.  To equalize mileage, these cars most probably returned empty via the service route to the CN.  


Other Thoughts:
  • I continue to be impressed with some of the large freight charges associated with shipments to the A&W.  This shipment, as well as several shipments we looked at to Algoma Plywood have been near the $1000/car mark.  Taking the weight of the blueberries at 40,824 lbs. together with the value of bulk fresh blueberries in the 1950s of about 20 cents per pound suggests that the value of the cargo was on the order of $8,000.  The shipping costs for the raw materials were over 10% of the value of the raw materials themselves.  Chicoutimi blueberries may have been something special, but wouldn't you think that Door County blueberries or maybe blueberries from western Michigan might have been a little more cost effective?
  • I've had this idea for a while that its better to build freight cars in pairs.  The real basis for the idea is that I'm pretty sure I'm going to screw up one of them during construction, and maybe out of two kits I can salvage one good car ;)  I sort of rationalize it with this vague notion that some shipments came in doublets (or even multiple cars).  This is the first example of a pure doublet that we've run across in this series of about 35 waybills, so as a rough guess we might estimate that there were maybe three doublets per 100 shipments.  Just on a lark, I looked at the first 100 entries in the A&W tables on the GBW page referenced above.  I found 5 instances of what I'll call a pure multi-car shipment, where identical loads came in on 2 or more cars from the same carrier and the same (or nearly identical) series.  And there were four more examples of what I'll call mixed multi-car shipments where identical loads came in on 2 or more cars (XMs and FMs) from different carriers.  This suggests to me the thought that multi-car deliveries to larger or busier consignees might occur with a frequency worth modeling.  
  • I've started to think about modeling commodity flows using three different ingredients.  The first is the meat and potatoes; the basic traffic lanes that make up 90% of the freight traffic on my layout.  These commodity flows are in the 1 car per 10 shipments to 1 car per 100 shipment frequencies.  Get these right and I'll probably have a pretty plausible scenario.  The second is the less frequent, but still pretty regular, rail shippers.  These commodity flows are in the 1 car per 100 to 1 car per 1,000 frequencies.  They may be seasonal, they may be from smaller shippers or consignees, but they add texture to the meal.  The third is the really rare shipments in the 1 carload per 10,000 frequency and beyond.  These are like the spices that add dash to the whole picture.  Although they are attractive and interesting, you don't want to use them too heavily though!
  • Andy's perspective on the preceding bullet, which I think states it well:  "you may want to add some clarification to your 1 in 10XXX figures (that those are based on the national averages).  Someone might think you will have to create 1000+ model waybills to get that amount of variability.  {cjh note - Andy is quite correct about this clarification!}  I used exactly your thought process on my A&W.  The lion's share of my waybills were the "standard" commodities/lanes.  Cans to Evangeline, Evap Milk out of Evangeline; steel into Christy Shipbuilding (from the mills that I had evidence of); sugar and cans into the canneries/team track, cherries out from same; petroleum products into the bulk dealers...then I put in some less common shipments to the variety of small industries...and the 'spice' were the few very unusual shipments like a large boiler, or a car for Door County Produce (which I only spotted twice in all my operating sessions), or a carload of ties for the A&W.  I used a file card system that had a lot of "MISC" waybills that I used for the spice.  I would typically only pull one or two each session...and having 40 or so waybills in there, it provided the right amount of variability.  Whereas, the Evangeline tab in the file was usually empty because all the bills were out (very little variability)."

Charles Hostetler and Andy Laurent

A Prototype Waybill - 35

$
0
0
One of the things I like best about prototype modeling is the interplay between theory and observation.  Of course the ultimate principal behind prototype modeling is to rely on observation, but it seems like sooner or later there's some gap that appears in the historical record.  Judging among the different tools to bridge those gaps is always an interesting exercise for me.  The waybill is a most useful historical record that connects a shipper, consignee, route, and commodity with a freight car.  The particular waybill that is the focus of this post describes a lot about the shipment of a tank car full of gasoline from  the Sinclair refinery in East Chicago to a Sinclair distributor in Sturgeon Bay.  But I think to fully appreciate what it would be like to see this shipment rolling into Casco Junction on a hot August day in 1962 we need to look a bit beyond the waybill itself.  There's a couple of interesting questions about the shipment that we just can't answer from this document alone.

The waybill is from the August 29, 1962 train.  This scan was provided by Andy Laurent:


Relationships to Other A&W Waybills:

In the table that Andy prepared that contains information from the first 326 waybills in the collection (on the GBW pages at http://www.greenbayroute.com/1962ahwwaybills.htm), line 92 contains a similar shipment.  On July 13 8084 gallons of gasoline were received at Sinclair in Sturgeon Bay from the East Chicago Sinclair refinery in UTLX 76881.  One might start to develop the theory that this shipment is part of a traffic lane, and that this traffic lane has different characteristics than the Standard Oil shipments we have discussed earlier.


Format:

This is a full-size 8 1/2" by 11" waybill with standard center-fold design.  The originating line-haul carrier was the EJ&E, and the waybill format is identical to the 2 other EJ&E waybills we have looked at so far.  The data fields are in the newer style layout, and the form probably dates from the late 1950s or early 1960s.  The EJ&E header is right justified across the top and the footer is centered across the bottom.


Typefaces, Preprinting, Stamps, and Handwriting:

The typeface is san serif, clean, and moderately bold.  The numbers are old style with open-top fours.

There is no preprinting on the waybill.

The typical rectangular junction stamps, circular yard arrival stamps, and A&W destination stamp are present.  The revenue for the shipment was calculated under a weight agreement, and the Western Weighing and Inspection Bureau stamp is crisp and was easily separated from the background.  I compared this WWIB stamp with similar stamps on the other two EJ&E waybills we have looked at.  This shipment originated at EJ&E Station 74 (Gary, Indiana) and had stamp number 2789.  The other two shipments (of steel) originated at EJ&E Station 41 (South Chicago, Illinois) and both had stamp number 4092.  One working hypothesis is that the stamp numbers are correlated with the originating stations.  Another is that the stamp numbers designate the specific weight agreements between the shippers and carriers under which the shipment was made.  The IDP stamp from Waukegan, indicating data entry about the shipment into the C&NW data processing system, is typical of shipments that were routed via C&NW.  There is a big black "RUSH" stamp that I will discuss in more detail in the next section, and two green stamps "549" and "07" whose function is unknown at present.  These might designate station numbers along the route, train numbers, or specific yard routings in the Chicago Switching District.

The handwriting includes the destination agent's freight bill number and the notation to rush the shipment.


Dates and Waybill Numbers:

The waybill number was 748267, while the waybill numbers from the other two EJ&E system were 417742 and 41?018.  It may be that on the EJ&E series of waybill numbers were preassigned to stations.

The waybill was created August 20.  On August 23, the shipment was interchanged in Waukegan from the EJ&E to the C&NW.  The shipment was in Green Bay on the C&NW August 25, and interchanged onto the KGB in Green Bay on August 26.  The shipment was stamped received in Sturgeon Bay on August 29.

The duration between the waybill creation date and the received date for this shipment included parts of 10 days.  The other two EJ&E shipments (not stamped rush, and that were routed on the MILW via Rondout to Green Bay) took parts of 12 days and 16 days respectively.  Maybe the RUSH stamp did some good!


The Car:

The car was UTLX 72030, a tank car.  The Union Tank Car Company leased tank cars to Sinclair Refining Co. under both the SDRX and UTLX reporting marks.  The January 1958 ORER lists 4 items (items 116, 117, 121, and 122) for the range UTLX 71000 to 79999.  Since UTLX 72030 is not listed in any of the three noted items, we can associate it with item 116, which were 4523 "Tanks" with the AAR mechanical designation TM, 80,000 pounds capacity.

I am aware of two published photos of members of this item.

  • Kline and Culottaa, 2006 (The Postwar Freight Car Fleet, page 214) shows UTLX 71769 and describes it as a GATC product built in January 1920.  
  • Culotta, 2006 (Steam Era Freight Cars Reference Manual Volume Two:  Tank Cars, page 42) shows UTLX 78214 which is also a GATC product described as "WWI-era".  
In my collection I also have scans of five other cars of this item:  UTLX 71169, 71198, 72106, 72480, and 73676.  These five all share the same spotting characteristics as the cars discussed by Kline and Culotta and Culotta, namely double sill steps, lack of side and end sills, riveted radial top courses over a single longitudinal bottom course, four tank bands, and safety valves on the top of the dome.  At this point I was starting to develop a working hypothesis that UTLX 72030, the car identified by our waybill, was a 1920 GATC tank car.  

I just about let the matter drop at this point with the thought that although 7 cars out of 4523 is an infinitesimal sample, 100% of that sample were GATC 1920-era cars.  Fortunately, I happened to be cleaning up downstairs later that evening, and I ran across a P2K 8,000 gallon Type 21 riveted tank car kit in the stash lettered UTLX 78140.  I knew that P2K Type 21 tank cars were typically lettered from photography supplied by Richard Hendrickson, and this kit was labeled "Limited Edition", so I did a bit more digging.  

In STMFC 4217, referring to a P2K model (which he abbreviates as L-L for Lifelike) labeled UTLX 77340, Richard Hendrickson wrote:

"The L-L model is based on a photo in my collection of UTLX 77378, as well
as a photo of UTLX 94785. Both cars had the UTL standard placard boards,
sources for which have already been identified in a couple of other
responses. They also had only one platform and ladder (on the left side).
With regard to AB brakes, the arrangement fitted (or retro-fitted) to X-3s
of UTL's own design (and also used on L-L's model) was not followed in the
case of UTL-owned AC&F Type 21s. For some reason that isn't immediately
apparent, those cars had the reservoir with the AB valve directly above it
on the right side, opposite the cylinder."


and further in STMFC 5948:

"However, as I provided the prototype data for the L-L tank cars,
I can say with assurance that 77340 was an authentic number, based on
photos and documentation dating from the early 1950s. I can't say with
equal assurance that it was an authentic number in the late 1930s, as all
of the UTLX AC&F Type 21s were acquired second hand. However, many of them
came to UTL in the early 1930s when UTL bought the Skelly Oil Co. tank car
fleet, and it's highly likely that the Type 21s in the 77000 series were
ex-Skelly cars." 

So I think the most definitive statement that I can make about UTLX 72030 is that it was one of 4523 80,000 lb. capacity TMs in UTLX 71000 to 79999, and that both GATC-built and ACF-built cars have been identified as members of this ORER item.  The easier modeling approach would be to model the car as an ACF Type 21 and use the P2K model.  To model the car as a GATC product, one might consider Sunshine #99 (http://www.sunshinekits.com/sunimages/sun99b.pdf) if one could be found.  Another approach might be to use Tangent's underframe (which is a GATC Type 30 rather than a GATC Type 17), backdate the underframe, and try to find or fashion an appropriate 8K tank that would fit.


The Shipper:

The shipper was the Sinclair Refining Co.'s large refinery in East Chicago, Indiana.  It was served by the B&O Chicago Terminal, as well as by marine tanker.  The EJ&E's Gary station was located a couple of miles to the east, and this area was within the Chicago Switching District.  This was a huge facility that not only refined and shipped petroleum products but also produced petroleum coke and shipped a lot of chemical byproducts:


The Consignee:

The consignee was the Sinclair Refining Co. bulk facility in Sturgeon Bay.  This was a small bulk plant on the north side of Sturgeon Bay, close to Christy Shipbuilding Co.  It had 6 vertical tanks and a retail service station (inside black rectangle, upper right):

This facility in Sturgeon Bay was May Oil Co., dating from sometime prior to 1938 through 1960.  May Oil was originally affiliated with Texaco, but switched to Sinclair sometime prior to ca. 1960.  Other Sinclair bulk terminals on the Ahnapee & Western were in Casco and Maplewood (under the Casco Co-Operative Oil Co. name).  


The Route:

The line-haul route was:

GARY - EJE - WAUKEGAN - CNW - GREEN BAY - KGB - CASCO JUNCTION - AW - STURGEON BAY

I calculated the short line-haul as:

EJE:     120 miles
CNW:  165 miles
KGB:     23 miles
AW:       34 miles

total:    339 miles


The Commodity:

The commodity was 8,082 gallons of gasoline.  Gasoline was in ICC Commodity Class 501, Gasoline.  The weight and rate calculation was based on 6.6 lbs./gallon and 47.5 cents per hundred weight, resulting in a calculated weight of 55,341 lbs. and a calculated rate of $253.37.  If gasoline retailed for $0.25/gallon or so, the value at the pump of the gasoline was about $2,040; yet another example of the shipping costs being more than a tenth of the value of the cargo.  

The state to state data for Wisconsin in the 1% carload waybill survey show a changing pattern during the 1950s:
In the early 1950s, a majority of the rail traffic in gasoline was imports to Wisconsin from other states.  Toward the end of the decade, the rail traffic was much more evenly split among imports, exports, and internal distribution (i.e., Wisconsin to Wisconsin traffic).  This change in shipping pattern was a result of the increase in distribution of refined petroleum products by pipeline (e.g., the completion of the pipeline to Superior) and the increase in maritime deliveries through the Ports of Milwaukee, Green Bay, and Superior.  

This table shows the carloads per year for rail imports to Wisconsin, averaged over 1950 through 1952 and over 1956 through 1958:
From:<50-52><56-58>
Illinois1233700
Indiana1133233
Iowa133233
Kansas33333
Louisiana70033
Michigan3000
Minnesota20001433
Oklahoma213367
Texas2067167


total100332900

The overall decrease in imports to Wisconsin is apparent.  Our shipment in 1962 from Indiana is clearly part of a declining trend.  Note the large decline in rail traffic from states that are not adjacent to Wisconsin.  

This table shows the carloads per year for Wisconsin rail exports, averaged over the same time periods:
To:<50-52><56-58>
Iowa330
Michigan500467
Minnesota13001333
North Dakota6733


total19001833

There were an annual average of 2067 carloads originating and terminating in Wisconsin each year from 1950 through 1952, and 3867 from 1956 through 1958.  

Clearly during the early part of the 1950s shipments like the one portrayed in this waybill, from a producing refinery to a bulk distributor, were in the majority.  Toward the end of the decade the rail traffic in Wisconsin was much more redistributional; from intermediate terminals and storage facilities to local bulk distributors.  

In 1960, shipments from Indiana to Wisconsin in the 1% sample averaged 31 tons, 87 miles, and $87 in revenue.  Our shipment was slightly less heavy (at about 27 tons), but significantly longer and more expensive than the averages from the sample.  


Special Instructions:

There are no entries in the On C. L. - Traffic Instructions box.  The waybill is stamped "RUSH".  The originating agent also noted that the car had dangerous placards applied.  


Freight Car Distribution:

This is a privately-owned car that was on a mileage basis.  It was almost certainly returned empty via the service route to the shipper (on a regular freight waybill noting the last contents) to equalize mileage.  


Other Thoughts:
  1. As soon as I saw this waybill I thought of Ullman and the other economic geographers that were trying to create a semi-quantitative theory of the physical movements of goods in the 1950s.  According to these theorists, the major factors that promote trade are complementarity, lack of intervening opportunity, and propinquity.  This particular observable instance of trade does have a high degree of complementarity; there is a surplus of refined petroleum product at the refinery, and a corresponding demand for that product at the bulk distributor in Sturgeon Bay.  However, there are many intervening opportunities between the shipper and consignee; a situation that the theorists would argue would result in displacement.  For example, the Standard Oil distributors along the A&W got their products from the marine terminal in Green Bay.  We saw a waybill for a shipment of 8,000 gallons of gasoline from Green Bay to Algoma that took 2 days and cost $35, about one seventh of the time and cost of our shipment.  And if it just had to be from a Sinclair facility, the Sinclair marine terminal in Milwaukee was about 200 miles closer and on this side of the Chicago maze.  It is clear that in certain instances, traffic lanes are built up around corporate relationships, practices, and preferences that just don't fit the economic theories.  And I think one of the real values of the waybill collection is that periodically it reminds us of this important observable.  
  2. There were several marine terminals (including Sinclair) in the Port of Milwaukee for which I need to develop traffic profiles.  This waybill makes me want to think about an alternative to simply sending tank cars from these terminals to bulk distributors according to an economic gravity model.  I don't exactly know what approach to use right now, but it is a good challenge.  In our correspondence about this post Andy raised the notion that maybe the scaler quantity "distance" in the gravity model should be replaced with a vector quantity (i.e., something that has direction as well as magnitude).  This type of modeling is used a lot in geostatistics, for example trying to predict the shape and gradations in quality of ore bodies or petroleum reservoirs that are buried deep in the ground, difficult to sample, and directionally controlled.  There is a lot of recent literature on directional-based and network-based modeling summarized here (http://www.freight.dot.gov/fmip/models/library.htm#ref5) that might be interesting to look at.  
  3. In the absence of any other information, I think I probably would have modeled a shipment from a Sinclair refinery to a Sinclair bulk distributor in an SDRX car with a big white SINCLAIR across the front.  In fact, if you google sinclair tank car and click the images tab that's what you will see.  I think another one of the values of the waybill collection is that it sends us periodic little reminders to examine our preconceptions to become better prototype modelers.  
Charles Hostetler and Andy Laurent


A Prototype Waybill - 36

$
0
0
This waybill continues the documentation of the August 29, 1962 shipments to the Ahnapee & Western at Casco Junction.  It was scanned from the A&W Waybill Collection by Andy Laurent.  The waybill describes a shipment of coal from Coal City Indiana to Evangeline Milk Co. in Sturgeon Bay:


This waybill is nearly identical to the one described in detail in this post (http://cnwmodeling.blogspot.com/2013/05/a-prototype-waybill-28.html).  The shipper, consignee, route, commodity, waybill form, formatting, stamps, and typeface are all similar.  So for this post, rather than provide a repetitive discussion of the material from a previous post, we thought we would focus on  the freight car used for the shipment and on the profile of the rail deliveries to Evangeline Milk Co.

The Car:

The car is NYC 869343, a two-bay open top hopper car.  In the January 1958 ORER the NYC listed 1,982 Steel, Self-Clearing HM hoppers in NYC 868000 to 869999.  The dimensional data were:
IL  31' 6"
IW  10' 4"
OL  32' 6"
EW 10' 5"
EH  11'
Capy  2210 cu. ft. 110,000 lbs.

Two thousand of these hoppers were built by DSI for the NYC in 1948 under lot 769-H (http://www.canadasouthern.com/caso/NYC-MODELS-FREIGHT2.htm#L107; scroll about half way down, or search on the page by lot number).  There is also a builders photo here (http://www.canadasouthern.com/caso/images/nyc-868000.jpg).  In the modeler's notes Kadee 7001 is suggested as a reasonably accurate model with the note that the "NYC car was taller and shorter than the model" and that there are some differences in the side panels (http://www.kadee.com/store/index.php?main_page=product_info&products_id=652).  In STMFC message 79009 Gene Green mentioned that some cars in this series had Klasing handbrakes.


What did Evangeline Milk Co. receive by rail?

During the period June 27, 1962 through August 29, 1962 inclusive, Evangeline Milk received rail shipments of three commodities:

  • coal (ICC Commodity Class 305; Bituminous Coal)
  • metal cans (ICC Commodity Class 779:  Containers, Metal)
  • cardboard boxes (ICC Commodity Class 783; Containers, Fibreboard and Paperboard KD)

These were the coal shipments:


IDShipperFromOLHCCarDate
10Peabody Coal Co.Bixby Ky.ICIC 9322606/29/62
27Peabody Coal Co.Bixby Ky.ICIC 6915207/02/62
58Nashville Coal Co.Fies Ky.ICDH 622407/06/62
126Cardinal Fuel & Supply Co.McClure Ky.LNLN 6860807/20/62
156Cardinal Fuel & Supply Co.McClure Ky.LNLN 11905107/25/62
172Cardinal Fuel & Supply Co.McClure Ky.LNLN 8464207/27/62
200Cardinal Fuel & Supply Co.McClure Ky.LNLN 11826808/01/62
229Cardinal Fuel & Supply Co.McClure Ky.LNLN 7168908/06/62
250Peabody Coal Co.Coal City Ind.NYCNYC 87612908/10/62
270Peabody Coal Co.Coal City Ind.NYCNYC 87788308/15/62
283Peabody Coal Co.Coal City Ind.NYCNYC 87901708/17/62
PW28Peabody Coal Co.Coal City Ind.NYCNYC 86397708/27/62
PW36Peabody Coal Co.Coal City Ind.NYCNYC 86934308/29/62

The column marked ID contains either the row number from the table Andy prepared for the GBW pages (http://www.greenbayroute.com/1962ahwwaybills.htm) or the post number if the documentation was from a blog post (i.e., PW28 is Prototype Waybill post #28 and PW36 is Prototype Waybill post #36, this post).  There were 13 coal shipments to Evangeline during this 63-day period, about 1 every 5 days although it should be noted that the shipments came in irregular clumps.  4 shippers served by three different carriers are represented.  As we continue on to evaluate more waybills I'll be interested in finding out whether Evangeline cycled through a selected set of shippers or settled in on a preferred supplier.  Also note that in every case but one (the third entry in the table) the car for the shipment was a home road car.  It's interesting to me that a modeler of northern Wisconsin would need to roster IC, L&N, and NYC hoppers (and that's just to serve this industry; during the same time period there were coals shipments in C&O and MILW hoppers).  

These were the metal can shipments:

IDShipperFromOLHCCarDate
11Phelps Can Co.Burlington Wisc.SOOCNW 2108406/29/62
28Phelps Can Co.Burlington Wisc.SOONP 831207/02/62
29Phelps Can Co.Burlington Wisc.SOOCNW 870507/02/62
59Phelps Can Co.Burlington Wisc.SOOSOO 4800007/06/62
66Phelps Can Co.Burlington Wisc.SOOEL 7344807/09/62
78Phelps Can Co.Burlington Wisc.SOOSOO 4839407/11/62
101Phelps Can Co.Burlington Wisc.SOOSOO 4698807/16/62
113Phelps Can Co.Burlington Wisc.SOOSOO 4662807/18/62
127Phelps Can Co.Burlington Wisc.SOOSOO 4628207/20/62
137Phelps Can Co.Burlington Wisc.SOOPLE 2087307/23/62
173Phelps Can Co.Burlington Wisc.SOOSOO 13619407/27/62
188Phelps Can Co.Burlington Wisc.SOOSOO 4831407/30/62
214Phelps Can Co.Burlington Wisc.SOOCNW 2022608/02/62
230Phelps Can Co.Burlington Wisc.SOOSOO 13612608/06/62
249Phelps Can Co.Burlington Wisc.SOOSOO 13763408/10/62
260Phelps Can Co.Burlington Wisc.SOOEL 7340908/13/62
271Phelps Can Co.Weirton, W.Va.PRRPRR 2257908/15/62
289Phelps Can Co.Burlington Wisc.SOOUP 10421908/20/62
290Phelps Can Co.Burlington Wisc.SOOSOO 220608/20/62
323Phelps Can Co.Burlington Wisc.SOOSOO 4552608/27/62

There were 20 shipments of metal cans, or about 1 every three days.  All but one of the shipments were from the Phelps plant in Burlington, Wisc. which was served by the Soo Line.  The Phelps plant in Burlington was acquired from Nestle by Phelps in December 1959 and began production of 14.5 ounce milk cans for 5 milk plants including Evangeline Milk Co. (after 1959 baby cans were still produced in Weirton by Phelps, which accounts for the single shipment during this period that originated on the PRR).  The Burlington plant closed in August 1965 (about a year and a half after Evangeline shut down) and was sold back to Nestle.  This is a photo of that facility taken in 1949:


Home road boxcars were used for the Burlington Phelps shipments more than half of the time.  The other shipments were in what appears to be randomly selected cars; it did not appear that the SOO Agent in Burlington was overly concerned with the AAR Car Selection process.  

These were the cardboard box shipments:

IDShipperFromOLHCCarDate
268Mead Packaging Co.Lawrence Mass.BMBCK 234508/15/62
282Mead Packaging Co.Lawrence Mass.BMATSF 27664708/17/62

There were two shipments, or about one every 30 days.  Note that they came in a clump near the middle of the time period, two shipments separated by only a couple of days.  


Where did the product go?

The A&W collection only captures terminating waybills, so we have no direct evidence for the frequencies or destinations of rail shipments outbound from Evangeline Milk Co.  Andy does have some company newsletters from First National Stores (Evangeline's parent company, a grocery chain in the Boston area), and they describe both the manufacturing process at the plant, and some details including the routing of milk from Sturgeon Bay.  All the evaporated milk from the plant was shipped to First National Stores ("FINAST" brand).  Their warehouses were in Providence, RI and Somerville, Mass.  Route: AW-KGBW-C&O-NKP-DLW-NYO&W-NH for the Providence destination, taking 6 days.  Casco Cheese Company on the A&W was also owned by First National Stores, and sold 80% of their product to the Massachusetts chain as well.  

With respect to the Port of Milwaukee, data from Schenker (The Port of Milwaukee) suggest that a lot of evaporated and condensed milk from Wisconsin was shipped by car ferry to eastern destinations, and a lot was exported to Europe (of which some almost certainly entered the Port by rail).  


Charles Hostetler and Andy Laurent

FGEX Reefers - January 1958 ORER Transcription

$
0
0
This transcription is from the January 1958 ORER.  It was sorted from most numerous to least numerous items.  


PageItemMarkingAAR MDTotal#Start#End#FlgILIHDWCuFt (Gal)Capy (lbs)
56434FGEXRS10613210035898B33.2296.8334.000187275,000
5661FGEXRS7135550056999B33.2297.4174.000205075,000
56617FGEXRS6985700058899B33.2297.4174.000205075,000
56532FGEXRS6445000051999B33.2297.2504.000201390,000
56412FGEXRP60010001600B44.4177.8336.0003035128,000
56452FGEXRS5873600037999B33.2297.2504.000201375,000
56635FGEXRS5755900059999B33.2297.4174.000205090,000
56557FGEXRS4805500055499B33.2297.4174.000205075,000
56461FGEXRS3763800038449B33.2297.6674.000211075,000
5653FGEXRS3613863538999B33.2297.3334.000202275,000
5656FGEXRS2963900039299B33.2297.2504.000198775,000
56513FGEXRS2933950039799B33.2297.2504.000198775,000
56511FGEXRS1983930039499B33.2297.2504.000198775,000
56553FGEXRS1475223052679B33.2297.2504.000201390000
5652FGEXRS1343850138634B33.2297.3334.000202275,000
56616FGEXRS1025645656600B33.2297.4174.000205075,000
56413FGEXRP1001000010099B44.4177.8336.0003035128,000
56626FGEXRS995767557774L33.2297.4174.000205075,000
56446FGEXRS973590035999B33.2297.2504.000193375,000
56643FGEXRS975957559674L33.2297.2504.000198790,000
56611FGEXRS955615156248L33.2297.4174.000205090,000
56645FGEXRS945972559824L33.2297.2504.000198775,000
56516FGEXRS923980039999B33.2297.2504.0001987100,000
56652FGEXRS905990059999L33.2297.2506.000198790,000
56631FGEXRS705800058069B33.2297.4176.0002050100,000
56614FGEXRS655628056349L33.2297.4174.000205075,000
56424FGEXRS601610016299B33.2296.8334.000187275,000
5645FGEXRP56340399B43.6678.5006.0003217120,000
56336FGEXRP52115199L44.4177.8336.0003035128,000
56622FGEXRS525700157925L33.2297.4174.000205075,000
56463FGEXRS483845038499B33.2297.6674.000211075,000
56552FGEXRS465200552229B33.2297.2504.000201390,000
56633FGEXRS415808558200B33.2297.4174.0002050100,000
5644FGEXRP40260299B35.0007.4176.0001872105,000
56647FGEXRS395984159889B33.2297.4174.000205090,000
56624FGEXRS335728157860L33.2297.4174.000205075,000
56636FGEXRS325900059999L33.2297.4174.000205075,000
56433FGEXRS313200032099B33.2296.7504.000186075,000
5642FGEXRP30220249B43.6678.5006.0003217120,000
56612FGEXRS305620556279L33.2297.4174.000205090,000
56628FGEXRS305792657955L33.2297.4176.000205075,000
56414FGEXRS281085010999B33.2297.2504.000199675,000
56421FGEXRS271130111349B33.2296.7504.000186175,000
56425FGEXRS261630016489B33.2297.2504.000199375,000
56523FGEXRS214350046797B32.5836.8334.000188590,000
56534FGEXRS185000051999L33.2297.2504.000193390,000
56632FGEXRS155807058084L33.2297.4174.0002050100,000
56415FGEXRS141100111175B33.2297.0004.000192475,000
5641FGEXRP11209219B43.6678.5006.0003155120,000
56554FGEXRS115268052779B33.2297.2504.000199690,000
56634FGEXRS115890058999B33.2297.4174.000205090,000
5643FGEXRP10250259B34.7507.2506.000207899,000
56524FGEXRS104350046797L32.5836.8334.167188790,000
56533FGEXRS75000051999L33.2297.2504.000193390,000
56561FGEXRS75500055499L33.2297.4174.000205075,000
56334FGEXRB6101109B33.7507.2506.0002024100,000
56536FGEXRS65000051999L33.2297.2504.000193390,000
56621FGEXRS65700057323L33.2297.4174.000205075,000
56521FGEXRS43989339896L33.2297.2504.0001987100,000
5665FGEXRS45603856481L33.2297.4174.000205075,000
56422FGEXRS31144211540L32.5006.8334.000180950,000
56535FGEXRS35000051999L33.2297.2504.000193390,000
56543FGEXRS35102751468L33.2297.2504.000193390,000
56564FGEXRS35517955461L33.2297.4174.000205075,000
56423FGEXRS21400914557B32.5006.8334.000190775,000
56427FGEXRS21810918342B32.5007.2504.000196950,000
56435FGEXRS23210232579L33.2296.7504.000186075,000
56436FGEXRS23379834233L33.2297.2504.000201375,000
56441FGEXRS23324935060L33.2297.2504.000201375,000
56444FGEXRS23588135882L32.5006.7504.000178950,000
56453FGEXRS23619737484L32.6677.2504.000197975,000
56454FGEXRS23642937655L33.2297.2504.000201390,000
5654FGEXRS23882738941L33.2297.3336.0002022100,000
56526FGEXRB24512146719L39.8337.0834.167239090,000
56542FGEXRS25020450643L33.2297.2504.000201390,000
56547FGEXRS25186751900L33.2297.5004.000209490,000
56562FGEXRS25502255271L33.2297.4174.000205075,000
5662FGEXRS25528455879L33.2297.4174.000205075,000
5664FGEXRS25603056068L33.2297.4174.000205075,000
56627FGEXRS25784957855L33.2297.4174.000205075,000
56637FGEXRS25907859572L33.2297.4174.000205075,000
56642FGEXRS25934559563L33.2297.4174.000205075,000
56651FGEXRS25985159852L33.2297.4174.000205090,000
56335FGEXRP1111111B33.2297.1254.0001894100,000
56341FGEXRP1205205B43.6677.9176.0002986125,000
56342FGEXRP1207207B34.6677.2504.0002110100,000
56343FGEXRPM1208208B34.0006.4176.000181475,000
5646FGEXRP1380380L43.6678.2506.0003130120,000
56411FGEXRP1399399L44.5007.8336.0003041120,000
56416FGEXRS11122611226B32.2506.6674.000171750,000
56417FGEXRS11125111251B32.2506.6674.000171750,000
56426FGEXRS11806518065B32.5006.5004.000175050,000
56431FGEXRS12120221202B33.2296.7504.000186075,000
56432FGEXRS12133921339B32.5006.7504.000178950,000
56442FGEXRS13418234182L32.2297.6674.000211075,000
56443FGEXRS13445734457L33.2296.7504.000186075,000
56445FGEXRS13588435884L32.5006.7504.000178950,000
56451FGEXRS13595135951L33.2297.4174.000205075,000
56455FGEXRS13643936439L32.6677.2504.000197975,000
56456FGEXRS13714937149L32.7507.2504.000198475,000
56462FGEXRS13803438034L33.2297.5834.000208775,000
5651FGEXRS13850038500B33.2297.3334.000202275,000
5655FGEXRS13896738967L33.2297.2506.0001987100,000
5657FGEXRS13907439074L33.2297.2506.000198775,000
56512FGEXRS13940039400L33.2297.2504.0001987100,000
56514FGEXRS13971939719L33.2297.2506.0001987100,000
56515FGEXRS13973039730L33.2297.2504.0001987100,000
56517FGEXRS13989239892L33.2297.2506.0001987100,000
56522FGEXRS14000040000B33.2297.2504.000198780,000
56525FGEXRB14634446344L40.0007.1674.167250190,000
56527FGEXRB14633546335L40.0007.0834.167238790,000
56531FGEXRS14679746797L32.5836.8334.167187790,000
56537FGEXRS15002750027L33.2297.2504.000185290,000
56541FGEXRS15017950179L33.2297.0004.000187290,000
56544FGEXRS15138651386L33.2297.2504.000193390,000
56545FGEXRS15166551665L33.2297.2504.000193390,000
56546FGEXRS15180551805L33.2297.2504.000201390,000
56551FGEXRS15200352003B33.2297.2504.000193390,000
56555FGEXRS15278152781B33.2297.2504.000201390,000
56556FGEXRB15278652786B38.7507.1674.000222975,000
56563FGEXRS15503255032L33.2297.4174.000205075,000
5663FGEXRS15592355923L33.2297.4174.000205075,000
5666FGEXRS15607056070L33.2297.4174.000205075,000
5667FGEXRS15613756137L33.2297.4174.000205075,000
56613FGEXRS15624956249L33.2297.4174.000205090,000
56615FGEXRS15629156291L33.2297.4174.000205075,000
56623FGEXRS15725757257L33.2297.4174.000205090,000
56625FGEXRS15764557645L33.2297.4174.000205075,000
56641FGEXRS15932559325L33.2297.4174.000205090,000
56644FGEXRS15960659606L33.2297.4174.000205075,000
56646FGEXRS15982159821L33.2297.2504.000198775,000


TOFC Traffic - Some Preliminary Thoughts

$
0
0
I've been trying to get a handle on how I should portray Trailer-On-Flat-Car (TOFC) traffic through Milwaukee in the fall of 1957.  The late 1950s were a time of rapid changes in TOFC traffic patterns and commodity flows, and the nature and occurrence of TOFC traffic was quite variable across different railroads.  I started out looking at some national trends; but I ended up spending most of my time looking at the local characteristics of CNW TOFC traffic.  

The 1% carload waybill survey lumped TOFC traffic in with all other "ordinary" flat car traffic.  This makes it quite a bit of work to go through each of the 261 ICC commodity classes to see whether it is possible to tease out what and how much TOFC traffic was generated even on a national basis.  But I was curious as to whether I could develop a methodology to do this and I started with a look at the total carloads and the total flat car loads for year during the 1950s (click to enlarge):
This presentation basically tells us that total carloads in the 1% sample were around 300,000 per year (which equates to about 30,000,000 carloads nationally per year) and that a tad less than 10,000 of the carloads were carried on a flat car.  Throughout the 1950s the flat car traffic nationally was between 2 1/2 to 3 1/2 percent of total traffic.  Although it is sort of hard to see in this bar chart, there was a national decline in total carloads of about 20% during the decade, while the flat carloads actually increased about 20%.


It is a bit more obvious in this plot which shows the number of carloads in the sample relative to 1950.  This presentation a split between the orange and blue bars that starts roughly in 1957.  After the middle of the decade flat car traffic is systematically increasing relative to 1950 (except for the mild recession year of 1958 when all rail traffic was in a trough) while total carloads were decreasing relative to 1950.  The rise in the percentage of flat carloads in the sample reflects the growth of the TOFC traffic.  This growth is quite modest - probably about 1,000 carloads in the annual 1% sample can be attributed to TOFC traffic.  This equates to perhaps 100,000 national carloads per year which is on the order of 250 per day.


I wondered whether this subtle but interesting time marker would show up in individual commodities.  So I looked at total carloads and flat carloads as a function of time for two separate commodity classes.  The first is ICC 411 (Lumber, Shingle, and Lath) which I did not think participated in the growth of TOFC traffic at the end of the decade.  The other was ICC 583 (Manufactured Iron and Steel) which is a rather broad category which I thought might have captured some TOFC traffic.  

Here are the plots for Lumber, Shingle, and Lath:


It would appear that flat car lumber traffic decreased by about 20% during the decade and total lumber traffic decreased by a bit more than 40%.  I see no sign of an expansion in lumber traffic that could be attributed to TOFC.  

Here are the corresponding plots for Manufactured Iron and Steel:

Total carloads of Manufactured Iron and Steel were reasonably steady during the 1950s.  However, the number of flat car loads of the same commodity rose dramatically after 1956.  To me, this appears to be the signature of a diversion of a small portion of the Manufactured Iron and Steel traffic to TOFC (perhaps 200 in the 1% sample or 20,000 carloads nationally).  

So using this methodology, I think one could sort through the various commodity classes and figure out which ones were the major contributors to TOFC traffic on a nationwide basis.  I'll hold that thought for a while and see whether it feels like its worth the work...

In the meantime, I also sorted through the Freight Traffic Redbook (1955 edition) and spent some time looking at pages 1115 through 1133 (Highway Trailer Transported on Flat Cars).  I originally included a long (and rather tedious) summary of that material in a draft version of this post but I edited it out for brevity.  The heart of the matter for those of us interested in modeling commodity flows is that in 1954 the ICC issued a ruling in response to a petition filed by the New York, New Haven & Hartford R.R. Co.  This ruling answered 12 questions put forward by the carriers and substantially clarified what was considered permissible for a railroad carrier to do with TOFC traffic.  Four broad business areas were thus defined:

  1. a railroad could transport freight in its own trailers loaded onto flat cars, at both less carload and carload rates;
  2. a railroad could transport freight in trailers owned by a private carrier loaded onto flat cars, even if the trailers had a prior or subsequent highway movement;
  3. a railroad engaged in TOFC service could establish through rates and joint rates with a motor common carrier using the common carrier's trailers on the railroads flat cars;
  4. a railroad could transport freight in trailers owned by a third party, and loaded by a freight forwarder.  

Given this variability of business models, and the relative lack of standardization of rates, equipment, and terminal facilities, different railroads were at different stages of adoption of TOFC in the late 1950s.  Fortunately, in 2001, Jim Eager searched through new reports and article in Railway Age magazine, and even more fortunately his summary is still available on line (http://www.hosam.com/aar/tofc.html).  I also cross checked the information in this summary with Chapter 4 (Intermodal) of Patrick Doran's book "Chicago & North Western Freight Trains and Equipment" and the two appear to be consistent.  

So in September/October 1957, the C&NW:
  • had a modest and declining amount of LCL traffic to and through Milwaukee (Chicago-Green Bay) that was in CNW trailers on CNW 53' FC converted flat cars.  Some of this traffic might have shown up at Transit Shed 1, but otherwise it was not likely that this traffic would have been visible in the Port of Milwaukee.  
  • had a mature and increasing amount of carload traffic to and through Milwaukee (Chicago-Green Bay) that was in both CNW trailers (smaller amount and declining) and third-party trailers carried on CNW 53' FCs.  Again, probably most of this traffic was not visible in the Port area.  
  • had joined Trailer Train and was loading third party trailers on TTX 75' F39 and 50' F30 flat cars with ACF hitches.  
  • had established interline service and joint rates from 41 stations on the CNW (including Milwaukee) and more than 800 stations on the MON, BO, DLW, GN, LV, NKP, PRR, RDG, UP, WAB, WM, ERIE, ATSF, MKT, SLSF, SSW, SP, and PWV.  Some of this traffic originating in the Twin Cities, northern Wisconsin, and Milwaukee could have been routed across the lake via car ferry, so TTX cars with third-party trailers would have been the most common manifestation of TOFC traffic through the Port of Milwaukee.  

Lastly, there is a nice ground-based photograph of the Milwaukee TOFC ramp in Jeff Wilson's "Industries Along the Tracks Volume 3" on page 81 (http://books.google.com/books?id=MuAvdPERmekC&lpg=PA81&ots=KNq1M0LfNQ&dq=ramp%20in%20Milwaukee%20features%20wood%20planks%20on%20heavy%20stringers&pg=PA81#v=onepage&q=ramp%20in%20Milwaukee%20features%20wood%20planks%20on%20heavy%20stringers&f=false).  The C&NW's fruit warehouse is in the background, and the C&NW's freight terminal and the freight forwarder's facilities are just out of sight to the left of the photo.  I have a medium-resolution scan of a 1958 aerial photograph that has 3 75' flat cars at this ramp; probably TTX F39s.  

Charles Hostetler
Goshen, Ind.

A Prototype Waybill - 37

$
0
0
A couple of posts ago we looked at a waybill that documented two shipments from Canada in Canadian rail cars (blueberries from Quebec in 8-hatch overhead bunker reefers) that turned out to be a very rare commodity flow.  That waybill offers an opportunity to feature a couple of interesting and recognizable freight cars, but its plausible application to a variety of layout situations is rather limited.

Today's waybill also involves a shipment from Canada but it exemplifies a much more common commodity flow.  In fact, shipments of newsprint from Canada were the single largest commodity flow from Canada in the 1950s, and they even outnumbered domestic (U.S. to U.S.) rail shipments of newsprint by a wide margin.  As we will see, this commodity flow from Canada to the U.S. was not geographically restricted either; significant numbers of these shipments terminated in most U.S. states throughout the 1950s.  This waybill is transferrable to a wide variety of layout situations.  Andy provided the scan from the A&W Waybill Collection:


Relationship to Other A&W Waybills:

Row 87 in the waybill table Andy made for the GBW pages that cover a two month period contain one related shipment (http://www.greenbayroute.com/1962ahwwaybills.htm).  This related waybill was a shipment of newsprint in Ontario Northland 90228 (a box car in the same series as the box car from this waybill) from the Abitibi Sales Co. Ltd. (the same shipper from this waybill) to Algoma Printing Co. in Algoma.  The routing on the related waybill appears to be a bit more efficient than the routing on this waybill; we'll expand on that a bit in the routing section of this post.


Format:

This is a standard-sized waybill with center-fold symmetry.  The layout of the data fields is a bit different in organization than the other waybills we have seen, which adds a bit of variety.  The form is undated.  The header is centered rather than the more typical right-justification.  The interline code number is only on the left side of the carrier name in the header, whereas all of the waybills we have looked at to date have the interline code number repeated on both sides of the carrier name.  This waybill would visually stand out in a packet of standard forms.


Typefaces, Preprinting, Stamps, and Handwriting:

This is a third instance (occurring about 1 in every 10 times or so) of lower-case type used by an agent/clerk.  The typeface is serif, crisp, and extended.  The numbers are newer style (lining) with closed top fours.

The station (Iroquois Falls, Ont.) and the shipper (Abitibi Sales Company, Limited) appear to be preprinted; their placements are perfectly horizontal and centered in the fields.  Andy confirmed that these are preprinted by re-examining the waybill.  The notation "Customs Papers Attached Shippers Load and Count" may also be preprinted.  The Abitibi Power & Paper Co. Ltd. was an important shipper on an otherwise sparsely populated branch line, and preprinting may have saved the agent a lot of time.

The typical yard arrival stamps (circular) and interchange stamps (rectangular) document the progress of the shipment.  There are stamps documenting entry into the data processing systems of the Ontario Northland (ABSTRACTED NORTH BAY O.N.R.), the Canadian Pacific (the triangular stamp BASIC REPORTED NORTH BAY KZ and ABSTRACTED AT NORTH BAY C.P.R.), the Soo Line (BASIC TAPE PREPARED SOO), and the CNW (IDP C&NW E. ST. PAUL).  There is a fainter stamp just below the ABSTRACTED AT NORTH BAY C.P.R stamp that contains some data fields with handwriting that may have been part of the data entry process.  There is a stamp documenting the passage of the car through customs at Sault Ste. Marie.  The weight for the shipment was calculated by Shipper's Load and Count under a weight agreement.  The stamp documenting the weight agreement reads "222 This Stamp must be used ONLY ON billing for business Covered by Weight Agreement" supports the hypothesis that the stamp number is correlated to the commodity (rather than to the station of origin).


Dates and Waybill Numbers:

The waybill number was 6022 with the notation Int. K appended.  This waybill number may have been one in a series reserved for international shipments.

The waybill was created on August 18, 1962 in Iroquois Falls, Ontario.  On August 19th, the shipment was interchanged from ONT to CP in North Bay.  On August 21st, the shipment was interchanged to the SOO at Sault Ste. Marie (Mich.).  On August 26th the car was interchanged from the C&NW to the KGB via the GBW in Green Bay.  The shipment was stamped received in Sturgeon Bay on August 29.


The Car:

The car was ONT 90955, a box car.  This was one of 985 Steel XMs in ONT 90000 to 90999 listed by the Ontario Northland in the Jan. 1958 ORER.  The dimensional data were:

IL  40' 6"
IW  9' 2"
IH  10'
OL  41' 8"
EW 10' 8"
EH  14' 8"
Door Opening 6' wide by 9' 5" high
Capy  3712 cu. ft. and 90,000 lbs.

These were 1937 AAR-style box cars built by National Steel Car Co. in 1947.  There's an exceptionally good on-line in-service photo of ONT 90126 here (http://searcharchives.vancouver.ca/uploads/r/null/9/2/926705/74f4a0d9-dfb1-4959-bac0-e38686d76fd0-A28874.jpg).  Note the car ends with the vertical bars between the horizontal ribs and the stenciled notation "THIS CAR FOR CLEAN LADING ONLY".  Another photo of a car in the Ontario's Development Road scheme is here (http://www.trainlife.com/magazines/pages/2/87/june-1989-page-19).  Swain and Hendrickson (1988) discussed Canadian prototypes for the 1937 AAR-style boxcars in this article (http://www.trainlife.com/magazines/pages/321/23950/august-1988-page-48) although they did not directly discuss the Ontario Northland cars.  In HO, an easy modeling approach is the Trueline Trains car with NSC ends:  http://www.truelinetrains.ca/freight-cars/1937-40-box-car.


The Shipper:

The shipper was Abitibi Sales Co. Ltd.  This was the distribution and shipping arm of Abitibi Power & Paper Co. Ltd., a major newsprint producer in northern Ontario.  The paper mill is still in operation and an oblique aerial photograph of the site graces the home page of Iroquois Falls (http://www.iroquoisfalls.com).  It was a big facility that was at the end of a branch line on the Ontario Northland near the northern end of the main line.  Abitibi Power & Paper developed the hydroelectric plant and the paper mill that became a major producer of newsprint for the midwestern U.S. (http://www.heritagetrust.on.ca/CMSImages/50/5030a14e-6834-47e6-8a33-1d09cdd788d9.pdf)


The Consignee:

The consignee was the Door County Advocate, a newspaper publisher.  Their facility was located at 11 North 3rd Ave. in Sturgeon Bay, in an area that was not served by rail.  This shipment was a delivery to the A&W team track which was several blocks north of the newspaper publisher.  The Algoma Printing Co. had a similar arrangement for unloading at the team track in downtown Algoma.


The Route:

The route was:

IROQUOIS FALLS - ONT - NORTH BAY - CP - ST. MARY'S TRANSFER (SAULT STE. MARIE) - SOO - ST. PAUL - CNW - GREEN BAY - KGB - CASCO JUNCTION - AW - STURGEON BAY

I calculated the short-line haul as:

ONT   236 miles
CP      258 miles
SOO   491 miles
CNW  302 miles
KGB     23 miles
AW       34 miles

total  1,344 miles

I appears to me that the trip could have been shortened about 500 or 600 miles by more judicious routing in northern Wisconsin, rather that taking the SOO all the way over to St. Paul and the CNW all the way back east to Green Bay.  The shipment of newsprint from Abitibi to Algoma used a SOO - MILW connection in northern Wisconsin that was much more efficient.


The Commodity:

The commodity was 26 tons of newsprint (48 rolls).  Newsprint was in ICC Commodity Class 657, Newsprint.  The weight was calculated from shipper's load and count under a weight agreement.


Data Regarding the Commodity Flow:

The ICC 1% waybill survey shows that on a national basis, commodity flows of newsprint were consistently strong through the 1950s.  In fact, unlike most other commodities we have looked at, domestic terminations of newsprint actually increased during the decade:

The vast majority of these shipments were in box cars.  The exceptions in the 1% sample were 2 shipments in refrigerator cars and 8 shipments on flat cars.  The flat car shipments were all post-1955 and were probably TOFC traffic.

On a state-to-state basis Maine was consistently the dominant source of domestic carloads of newsprint (Washington state was a distant second, shipping primarily to a few states in the west).  This map shows the average annual carloads of newsprint originating in Maine during the period 1951 through 1953:


Commodity flows from Canada to the U.S. were about two to three times the domestic flows.  This map shows the average annual carloads of newsprint originating in Canada during 1951 through 1953:


This map shows the national distribution and high intensity of Canadian newsprint rail shipments.  This is not a small diffusive flow leaking across the border - it is a total domination of the commodity flow by a small number of Canadian newsprint producers.

Looking at the rail traffic from the consignees point of view, this table shows the sources of newsprint for consignees in Wisconsin during that same period:


To Wisc.<51-53>

From:Carloads<tons/car><Rev/car>
Canada216730412
Wisconsin6725138

At 26 tons and a revenue of $615, our shipment was a bit lighter and a bit more expensive than the average shipment from Canada.  Note that Canadian rail shipments of newsprint outnumber all domestic shipments to Wisconsin by a factor of about 30.  Wisconsin was fairly typical in this respect.  In the eastern U.S. there was a bit more domestic competition, primarily from in Maine:

To N.Y.<51-53>

From:Carloads<tons/car><Rev/car>
Canada2076727397
Maine276727339
Massachusetts3320174
New Hampshire3327274
New Jersey3329195
New York3324120
Wisconsin3323403

and only in California was domestic traffic greater than Canadian:


To Calif.<51-53>

From:Carloads<tons/car><Rev/car>
Canada60030650
California14332840
Oregon36730399
Washington126730482
Wisconsin6724920

Data from 1963 (Schenker, The Port of Milwaukee) show that there was a strong marine flow in newsprint and suggest that much of the Canadian newsprint rail traffic arrived via car ferry:


TonsBox Car Eq.
Imports (shipborn)553801846
Car Ferry Receipts989443298
Car Ferry Shipments67623


Special Instructions:

There were no special instructions.


Freight Car Distribution:

This is a home road car shipped to a foreign-road destination, Class 1B.  This appears to have been typical for Canadian shipments to the U.S.


Other Thoughts:

This waybill got me thinking about the notion of transferability.  Suppose we consider a waybill documenting a shipment transferrable if if is plausible not just in its own setting, but in a wide variety of contexts.  It seems to me that the waybill documenting the blueberries from a Canadian grower to a canning plant are not readily transferrable to other settings.  This waybill tells me something about Ahnapee and Western traffic patterns, but not much that is generalizable to Milwaukee or Cleveland or Orlando.  The delivery of newsprint from Canada in a Canadian car seems transferrable to almost any setting in the United States in the 1950s.  All that's required is a local newspaper publisher and a team track on which to make the delivery.  In this sense the A&W collection is not just documenting something that happened within the localized setting of Sturgeon Bay Wisconsin, but is exemplifying something that occurred across much of the U.S.

Modeling in the western U.S. you might modify the newsprint scheme a bit using different shippers and cars:

British Columbia Forest Products Ltd., originating in Vancouver on the CP
Crown Zellerbach Canada, originating in North Vancouver on the PGE or CP

while in the east one could consider:

Howard Smith Paper Mills Ltd., originating in Windsor Mills Quebec on the QC/CN

and in the midwest, in addition to Abitibi one could mix in:

Howard Smith Paper Mills Ltd., originating in Cornwall Ontario on the CP/CN
Spruce Falls Power & Paper Co. originating in Kapuskasing Ontario on the CN
Ontario Paper Co., Ltd. originating in Thorold Ontario on the THB/CN

In any case, this is a plausible opportunity for relatively frequent shipments in a Canadian box car to almost any U.S. destination in the 1950s.

Charles Hostetler and Andy Laurent


Canadian Rail Flows of Fertilizer Materials

$
0
0
In an earlier waybill post (http://cnwmodeling.blogspot.com/2013/12/a-prototype-waybill-37.html) we discussed the commodity flow of newsprint from Canada to the U.S.   I remarked that it was the dominant rail flow of Canadian commodities to the U.S., and that in fact it exceeded domestic newsprint sources by a wide margin.  

In a query to the STMFC, Eric Neubauer wrote:

"How about potash? At least recently most seems to come from Canada.

Eric"


Potash is a commodity in commodity class 539, Fertilizers N.O.S.  Unlike newsprint, which is a homogeneous commodity class, fertilizers are a diverse mix of materials (some of which are fairly unsavory):

Commodity Class 539
Fertilizers, N.O.S.
Agricultural Lime
Agricultural Limestone
Alkali salts, crude
Ammonia, sulphate of
Ashes, bagasse
Ashes, brush
Ashes, burr
Ashes, cactus
Ashes, cotton boll
Ashes, cotton hull
Ashes, Kelp
Ashes, manure
Ashes, wood
Basic slag
Blood, dried (not feed)
Bone black, spent
Bone, charred filtering
Bone dust
Bone, ground
Bone meal, fertilizer
Castor bean hulls
Castor pomace
Cement flue dust
Charcoal, animal, spent
Chile saltpeter
Cocoa bean shells
Cyanamid
Distillery molasses
Fertilizer blacks
Fertilizer compound
Fertilizer ingredients
Fertilizer, noibn
Fertilizer, wool waste
Fish tankage
Furfural residue
Grape pomace
Guano
Hartsalz
Hoof meal
Norn meal
Humus
Kainit
Kelp
Land lime
Lime, nitrate of
Lime nitrogen
Manure, animal
Manure salts
Marl, agricultural
Mussel meat, inedible, dry
Nitrogen fertilizer solution
Oyster shell lime
Peat moss
Peat or peat filler
Phosphate matrix blend
Plant food
Potash, beet or cane residuum
Potash magnesia, sulphate of
Potash, nitrate of
Potash, noibn
Potash, sulphate of
Salts, agricultural
Shrimp hulls
Sludge, sewage
Sugar cake mud
Sylvinite
Tank water, evaporated
Tankage, fertilizer
Tankage, garbage, dry


The inhomogeneity of the fertilizer commodity class means that the conclusions we can draw from the statistics of freight car movements have to be considered in the context of a variety of sources and destinations.  

The following data are from the 1% Carload Waybill Sample taken from 1950 through 1960. The domestic commodity flows are shown in this chart:


On a national basis the domestic commodity flow was moderately strong and certainly the frequency of rail shipments was steady throughout the decade.  This chart shows the distribution of those carloads among the various AAR mechanical designations:


Shipments in stock, refrigerator, and flat cars numbered 18 throughout this period and have been suppressed from this display for clarity.  The freight car types were dominated by box cars, but there was a persistent usage of open top cars, special cars, and tank cars that reflects the diversity of materials in commodity class 539.  


Most states shipped fertilizers by rail.  This map shows the frequencies and destinations of the shipments from Ohio averaged over the period 1951 through 1953:


Ohio's distribution pattern is fairly typical of the midwestern states.  The shipments are mostly regional in distribution and moderately dense.  Also a lot of the flows were reciprocal.  If I showed the plot for shipments from Georgia for example, we would typically see about the same number of carloads moving from Georgia to Ohio as moved from Ohio to Georgia.  In a recent eMail Dan Sweeney brought up this "coal to Newcastle" sort of economic issue, and it is clear that reciprocal shipments exist and also that they are prevalent in heterogenous commodity classes.  

So the domestic commodity flow looks like the superposition of about 30 of these regional-scale blobs, each with a different geographic "center of gravity".  

The shipments from Canadian sources are not negligible, but they are certainly not dominant.  This map shows the frequency and distribution of carloads of fertilizer from Canada averaged over 1951 through 1953:


There's the signature of a fairly strong traffic lane to the west coast states (presumably from sources in B.C. and Alta.), and the geographic scope of the Canadian shipments is national, but the intensity is about a factor of 20 or so smaller than the domestic sources.  Canada is sort of analogous to a big state and Canadian fertilizers certainly didn't dominate the U.S. market.  

I would say that the statistics suggest that shipments of Canadian potash to consignees in Washington, Oregon, and California were a reasonably frequent occurrence during the 1950s, and if I were modeling this area I certainly would strive to portray this commodity flow.  But for the rest of the U.S. the arrival of a Canadian box car loaded with potash would probably be a lot more of a curiosity.  

Charles Hostetler
Goshen, Ind.   

A Soo TOFC Commodity Flow

$
0
0
I recently got an eMail from Bob Sterner regarding an interesting TOFC commodity flow on the Soo Line:

"Here's an unusual situation. According to an article in The Soo, in 1959 (my model year) the Soo began service whereby steel was loaded onto flat bed truck trailers and hauled via piggyback flats from "the dock" in Duluth to Whirlpool in St. Paul.  Since I model St. Paul I was happy to hear this, and I pretty quickly built some truck trailers and kitbashed to go along with some kitbashed piggyback flats I built some time ago (and published an article about, also in The Soo).  

I put "the dock" in quotes above because I don't know if that refers to the regular dock at the freight house or if it refers to something maritime.  


I am using prototype-inspired waybills on my layout so I'd like to try to get this right to go along with the models.  So, I'm wondering a couple of things here. 

1. Would steel on trucks be billed differently because of the trucks?  Or would the waybills just say something about the steel itself? 

2. Would a shipment say from a steel supplier in the lower Great Lakes that went first by ship and then by rail (perched on a truck) be billed all the way from the downlake shipper, or is it more likely the bill would just cover the rail segment?"


This commodity flow started in 1959, a bit after my era, but I thought it was a good example of how the different situations of individual rail carriers affected the implementation of TOFC traffic in the late 1950s.  In a previous post (http://cnwmodeling.blogspot.com/2013/11/tofc-traffic-some-preliminary-thoughts.html) I had discussed this concept of the variability in TOFC implementation as an interesting time marker that helps establish the time frame behind one's layout.  Bob is using this concept with the Soo on his St. Paul layout based in 1959, and has kindly agreed to collaborate with me on this post.  

You may recall from the previous TOFC post that in 1957 the CNW was moving past the carrier-owned trailers on carrier-owned flat cars on home routes.  It had established joint rates with other carriers (i.e., was shipping and receiving interline TOFC traffic) and was a member of Trailer Train.  The Soo, for a variety of reasons, was several years behind the CNW's implementation.  In 1959, the TOFC steel shipments from Duluth to St. Paul on the Soo were Soo-owned (or possibly leased) trailers on Soo-owned flat cars.  At this time the Soo had not established any interline rates, and so the TOFC traffic was entirely on its own rails.  


Was Domestic Interlake Traffic Part of this Commodity Flow?

Bob offered the suggestion that the steel was produced on the lower Great Lakes (e.g., Illinois, Indiana, Michigan, Ohio or Pennsylvania) and shipped via lake boat to the dock in Duluth.  My immediate reaction was that this wasn't very likely because of the demise of break-bulk shipping on the Great Lakes in the 1950s.  However, while Bob was doing some more research on the freight cars involved in the shipment I did some more research on the Great Lakes fleet and learned about the steel self-unloaders.  These were also called crane boats.  They typically were smaller and older than the bulk carriers (and there are some excellent smaller boats that would make good water front models).  With two (or more) cranes mounted above the deck they were ideally suited to transport iron, steel, and scrap.

There were 14 steel self-unloaders on the Great Lakes in 1959 (The Ship Masters Association Directory, 1959 edition):

NameYear Blt.Owner or Manager
Buckeye1900Columbia Transportation Corp., Cleveland Ohio
Detroit Edison1954Boland & Cornelius, Buffalo N.Y.
Harry T. Ewig1902Columbia Transportation Corp., Cleveland Ohio
Clifford F. Hood1902U.S. Steel Co., Cleveland Ohio
The Inland1926Inland Steel Co., Cleveland Ohio
Ironwood1902Nicholson Transit Co., River Rouge Mich.
Adrian Iselin1914Nicholson Transit Co., River Rouge Mich.
O.S. McFarland1903Columbia Transportation Corp., Cleveland Ohio
Manzzutti1903Yankcanuck Transportation Co., Sault Ste. Marie Ont.
G.G. Post1902Columbia Transportation Corp., Cleveland Ohio
Steel King1897Nicholson Transit Co., River Rouge Mich.
Sylvania1958The Tomlinson Fleet, Cleveland Ohio
Venus1901Boland & Cornelius, Buffalo N.Y.
Joseph S. Young?Boland & Cornelius, Buffalo N.Y.

This photo of the G.G. Post shows a typical steel self-unloader:

The G.G. Post was 353 feet in length, 48 feet at the beam, and carried two cranes with a 65-foot reach. The cranes had electromagnets for scrap and pig iron, and ordinary hooks for structural steel in bundles.

There's also good picture of the Manzzutti unloading pig iron at the Port of Milwaukee that shows the cranes in operation at http://content.mpl.org/cdm/singleitem/collection/MilwWaterwa/id/1010/rec/33.  The Manzzutti was 246 feet long, 41 feet at the beam, and had a diesel-powered crane with a 60-foot reach.

One of my favorite photos includes the Harry T. Ewig at Transit Shed 1 in the Port of Milwaukee prior to her conversion to a steel self-unloader (http://content.mpl.org/cdm/singleitem/collection/MilwWaterwa/id/1023/rec/14).  A good photo of the same boat after conversion is at http://www.flickr.com/photos/jowo/5585074906/in/set-1558003.

The Soo magazine had an article in the Winter, 2009 issue on the Duluth 10th Ave. W freight house, which is shared with the WC.  It shows photos of ships docked at the facility.  One of these was the crane-equipped Elba.  The Elba isn't included in the Steel Self-Unloader section in the 1959 Directory, but is included in the general registry with the notation that the boat was equipped with "Steel & Scrap Cranes".  The Elba was 420 feet long, 52 feet at the beam, built in 1907, and was operated by Boland & Cornelius in Buffalo N. Y.  Another ship photographed at the dock was the Sir William Fairbairn.  The Sir William Fairbairn was listed in the 1959 Directory as a bulk carrier with no mention of crane equipment.  The Sir William Fairbairn was 425 feet long, 46 feet at the beam, built in 1896, and operated in 1959 by the Buckeye Steamship Co. out of Cleveland.  

So it is possible that the steel came from Cleveland, Detroit, or Buffalo on one of these boats.  In this scenario the steel would have been unloaded at the Soo Freight House in Duluth using the onboard cranes, or possibly at one of the nearby dock facilities and subsequently trucked to the Soo Freight House.

I think it is also possible that the steel was produced in the U.S. Steel (formerly Minnesota Steel Co.) plant in the Morgan Park area just southwest of the Duluth city limits.  In the late 1950s this plant was starting to specialize in the production of wire and fencing, but it was struggling to survive and was still producing coil steel.  It would have been an ideal candidate for a shipper looking for a good rate and regular service to a customer.  In this scenario the trailers could have been loaded at the U.S. Steel plant and driven to the Soo freight station in Duluth.

The Shipper:

In either scenario discussed above, the shipper would have been the Soo agent at Duluth.  This view was taken April 5, 1952 and shows the area around the Soo Freight Station in the Duluth harbor (click to enlarge):

The area shaded in blue is the Soo Freight House proper.  Note the standard rows of box cars all lined up along the water side of this peninsula.  Also note that there are no facilities (shore cranes) for transfer of break-bulk cargo in the vicinity, so a self-unloader would be required.  The area shaded in yellow is the National Carloading Corp., a freight forwarder.  At the time the photo was taken this facility was servicing two long strings of house cars.  In front of the National Carloading Corp. building, shaded in green, is the Soo TOFC ramp.  You can see three shorter (approximately 40') flat cars and one trailer.

A couple of miscellaneous notes about the Soo Freight House were unearthed during our research.  The aforementioned article in The Soo indicates that the building highlighted in yellow (National Carloading Corp.) was originally the Soo inbound freight house and the building highlighted in blue was originally the Soo outbound freight house.  With the decline in LCL traffic, sometime during or before 1954, the Soo either leased or sold the inbound freight house to National Carloading Corp. and consolidated their operations in the former outbound freight house.  This type of consolidation also happened in Milwaukee by the way, as several freight forwarders leased space in downtown Milwaukee in one of the C&NW's former freight houses.


The Consignee:

The steel was destined for the Whirlpool Corp. (St. Paul Division) facility in St. Paul, served by the SOO via the CNW (CMO).  Here's an aerial photo of the facility taken May 8, 1947, when this was the Seeger Refrigerator Co. prior to its acquisition by Whirlpool:

I've color coded the various areas of the plant according to their functionality as documented in the Sanborn map for the area published in 1946.  The areas in light blue are the steel receiving and enameling warehouses.  The area shaded in green is where electromechanical parts were received and stored.  The area shaded in red is the production/assembly facility, and the area shaded in yellow is for finished product storage and shipping.  The facility was set up quite nicely for receiving coil steel by rail, in an indoor covered facility convenient to the production area.

The photo below is of the same area but taken November 11, 1965:

I haven't color coded any areas because it is obvious that the plant had been substantially reconfigured by this time.  Note the increase in the number of truck trailers parked in the area and the increased access for vehicular traffic.  Shipping and receiving from this plant clearly changed quite a lot over the years.  In the March, 1952 C&NW Directory of Industries it is still Seeger Refrigerator Co. and it is served by the CMO (C&NW) and NP.  In the 1962 GN Shippers &/or Receivers Guide it is Whirlpool and it is listed as being served by the GN or CMO.  Finally, in the OPSIG Industry database a 1971 source lists it as being served by the Soo or CMO. Apparently, trackage rights or other agreements were shifting quite a lot in this part of town.  So the shipment of coil steel from Duluth to Whirlpool in Saint Paul on flatbed trailers loaded onto railroad flat cars was probably a relatively short-lived phenomenon which makes a really nice time marker for Bob's 1959 model year setting.

It is also possible that the trailers were unloaded from the flat cars at the Soo's Shoreham TOFC ramp in northern Minneapolis and trucked to Whirlpool.  I took a quick look at this area, which I thought was a pretty interesting TOFC setup.  This is a really nice view of Shoreham Yard taken November 28, 1966 (high-resolution scan, low angle lighting):

The Soo Freight House on the north side of Shoreham Yard is highlighted in blue, again with the typical rows of box cars along a freight transfer house.  To the west (left) of the freight house the TOFC ramp and trailer parking area can be seen.  If the rail part of the shipment ended here, then the consignee was probably listed as the Shoreham agent.  


Can One Identify This Commodity Flow in the 1959 or 1960 1% Carload Waybill Sample?

In the earlier post I looked at several time series of data and suggested a methodology for determining whether a particular commodity class was a component of the emerging TOFC traffic.  The methodology was applied to commodity class 583 (Manufactured Iron and Steel) with the result that, on a national basis, manufactured iron and steel was likely a participant in TOFC traffic growth post-1956.    Its quite a different proposition to find a recognizable signal in the state to state data.  I looked at the carloads of manufactured iron and steel originating and terminating in Minnesota during the 1950s, and the average number of carloads per year in the sample is about 10, with a standard deviation of about 4.  There's no particular temporal trend in the time series that suggests that this particular commodity flow was detected in the 1% sample.  If one postulates several TOFC carloads per week, say a couple hundred cars a year, of steel from Duluth to Shoreham, this might show up as 2 carloads in the sample. I include this discussion simply to reinforce the finding that the 1% carload waybill sample is a good place to look for national trends, and to identify typical, frequent commodity flows.  But the 1% sample is not a good place to look to find information about lower frequency events; at the layout scale it is much more important to understand local conditions if one wants to develop a good model of commodity flows.  


The Cars:

Looking at the Soo listings in the January 1958 and April 1959 ORERs, it appears that there were two types of TOFC flat car carriers (FCs) in the late 1950s.  In the January 1958 ORER the Soo rostered 2 FC cars (54315 and 54391) that were 52' 6" IL.  These were 50-ton cars.  By the time of the April 1959 listing these two cars had been converted to type FMS; equipped with bulkheads for wallboard loading and assigned to Ontario Paper Co. in International Falls Minn.  [I think these SOO 53' 6" TOFC FCs were the prototype for Tom Houle's articles "Piggyback Flats - Part 1 and Part 2" in the April and May 2005 Mainline Modeler.  He had modeled the car carrying 2 24' Soo trailers.]  The second type, and the more numerically important group of the Soo's FCs were the 35 cars in item 54101 to 54259 (odd numbers only, enumerated in note D1).  These were 40-ton cars, 40' IL, and 9' 3" IW.  

Bob prepared the following description of the prototype using information from The Soo, issues 22-2 and 22-3 along with unpublished data provided by Ken Soroos.

To inaugurate their “Rail-Van” service on March 1, 1955, the Soo converted four 52’6” Pullman Standard 50-ton capacity flats (built in 1939) of welded construction to piggyback service. This service connected several points in Wisconsin to Minneapolis/St. Paul. In 1956 the service was extended to Chicago and additional flat cars in this same series were similarly converted. Their length allowed for the loading of two 25’ trailers. Soo TOFC service was extended to Duluth-Superior in mid-1959. TOFC service on the Soo and elsewhere grew quickly in this time period; by 1961, there were Soo piggyback ramps in fifteen locations. While the number of locations served by TOFC was growing so too was the length of the truck trailers being used. In 1956 35-foot trailers were leased by the Soo for this service and in 1956, 40-foot trailers were acquired. Increased length meant two trailers no longer would fit onto a single 52’6” flat car, so the Soo migrated to loading single truck trailers onto 40-foot flat cars. In the January, 1959 ORER the two remaining 52’6” piggyback flats were still listed (54315 and 54319), but these had been converted to wallboard loading by April, 1959. At the time of the Duluth-Whirlpool St. Paul service discussed here, the Soo was relying on 35 41’5” flat cars from the 54101-54259 (odds) series, rebuilt to TOFC service in 1956-57. These cars had an interesting history, beginning their life as refrigerator cars (!), and rebuilt to flats in 1939. In the later 1950s they received further modifications with the addition of fishbelly side sills. Flatbed truck trailers of 40’ length were acquired in 1959 for the Duluth-Whirlpool service discussed here. These had two axles and were black with white lettering.

Models of the truck trailers and flat cars on Bob's layout were built as follows. Forty-foot flatbed truck trailers are offered by Wiseman Model Services (EBay seller wisemodserv). These kits consist of white metal parts and stripwood. They are re-releases of kits once offered by On-Trac. Two kits were built stock except for adding bulkheads with sheet styrene. Stripwood was stained prior to assembly. Color photos of other Soo trailers from the era show red wheels. Lettering was put together with a combination of N scale Microscale decals for Soo piggyback equipment and individual letters. The flats pictured here were a kitbash project done years ago with the intent to replicate the “look and feel” of Soo piggyback flats (as described in the article I wrote in The Soo 26-3. They are not prototypically correct, differing in overall length and other features.  Coil steel loads were purchased from Chooch (N scale) and weathered with artist oils to take away some of the sheen and add some character.  The smaller N scale coils help keep the truck trailers from appearing to be overloaded.

This photo was taken by Bob of the model operating on his layout:

I think it is a pretty nice piece of work with a distinctive prototype that sets a really nice time marker.  


Money, Mobility, or Something Else?

The flatbed trailers used in this service did not provide any protection from the elements for the coil steel.  They were not any easier to load or unload, and there was the added complication of securing the trailers to the flat cars.  The flatbed trailers were also much heavier than any dunnage would have been had the steel been simply shipped by flat car.  So why was this TOFC traffic, and why were the flatbed trailers acquired for this service?

We haven't been able to answer to this question with documentary evidence, but there are some inferences we might be able to draw from the situation.  They revolve around the considerations of money and mobility.  And these considerations are somewhat intertwined.

If the steel came from the U.S. Steel plant southwest of Duluth, and if we consider that this facility was served by the DMIR and NP (and that the U.S. Steel plant was not subject to reciprocal switching, necessitating including one of these carriers as the originating line haul carrier), we can see an opportunity for an enterprising Soo traffic manager to take a little business from the competition.  By publishing a TOFC tariff with favorable rates, the steel could be loaded at the U.S. Steel plant on the flatbeds, driven to the Soo Freight House, and travel entirely on the Soo to Whirlpool.  Favorable rates and the ability to expedite the shipment by controlling it from source to destination may have been useful selling points to the shipper.

It also seems clear that the trailers added no utility at all unless at least one leg of the trip involved transportation by highway.  Getting the steel from U.S. Steel to the Soo in Duluth to facilitate the direct routing is an example of transportation by highway at the origin of the shipment.  At the destination end, if the trailers were unloaded with the steel at the TOFC facility in Shoreham Yard, this might have allowed delivery to more than one Whirlpool (or associated subsidiary) facility in the Twin City area.  It is even possible that a small or portable unloading ramp was constructed at Whirlpool to move trailers from flats.


A Model Waybill

I created this model waybill for the shipment, assuming that the car was shipped from the Soo Freight House in Duluth to the Whirlpool Corp. directly in St. Paul and that the SOO had direct access via the CNW:


The header and footer are from a SOO freight waybill that dates from the late 1950s.  I like the rather ornate header, which appears to have been used on the SOO during the entire 1950s (I have seen this header  on both old- and new-style SOO waybills).  For this shipment, which probably had its own special tariff, I guessed that Shipper's Load and Count was the most likely way that the revenue was determined.  I added a Western Weight and Inspection Bureau stamp that was taken from a SOO waybill.  


Charles Hostetler and Bob Sterner


A Prototype Waybill - 38

$
0
0
Tonight's waybill from the August 29th train is for a tank car load of gasoline, shipped from a bulk terminal facility in Green Bay to a local distributor in Algoma.  Andy Laurent provided the scan from the Ahnapee & Western waybill collection:

This waybill is a near duplicate of the subject of the very first post in this series, written by Andy and I back in October of 2012 (http://cnwmodeling.blogspot.com/2012/10/a-detailed-look-at-prototype-waybill-1.html).

In fact, there are a number of related waybills in the A&W collection that have been documented to date:

RowDateMKNoContentGalsDest
1206-29UTLX5689Gasoline10285Algoma
2207-02UTLX71854Gasoline8084Forestville
4007-05UTLX36190Gasoline10201Forestville
4207-05UTLX22877Gasoline8156Algoma
7307-11UTLX10807Gasoline10084Forestville
8007-11UTLX5689Gasoline10285Algoma
8107-11UTLX72275Fuel Oil8085Algoma
10807-18UTLX10939Gasoline10090Forestville
13007-20UTLX39710Gasoline10144Algoma
15407-25UTLX5689Gasoline10285Forestville
15907-25UTLX24066Fuel Oil10071Algoma
19107-27UTLX39734Gasoline10166Algoma
19608-01UTLX36190Gasoline10201Forestville
21808-03UTLX39189Fuel Oil10177Algoma
21908-03UTLX40164Gasoline10164Algoma
22608-06UTLX9931Gasoline10197Forestville
25608-13UTLX39189Gasoline10177Forestville
27308-15UTLX39710Gasoline10144Algoma
28008-17UTLX35523Gasoline10213Forestville
30508-22UTLX74172Fuel Oil8138Forestville
30908-22UTLX10939Gasoline10090Algoma
32108-24UTLX36190Gasoline10201Forestville
PWB3808-29UTLX32399Gasoline10204Algoma

With the exception of the last entry, the column labeled row refers to the row number in the table that Andy prepared for the table on the GBW page that can be found at http://www.greenbayroute.com/1962ahwwaybills.htm.  The last entry (PWB38) refers to the 38th post in the Prototype Waybill series (this post).  This table is sorted by date (all dates are from 1962) and documents the inbound shipments to the A&W over a two-month period.

There are 23 total inbound shipments to two distributors.  Four of these shipments (about 15%) were fuel oil and the remainder were gasoline.  All of the tank cars were marked UTLX and originated at the Standard Oil bulk terminal in Green Bay (shown in the post referenced above).  A mixture of 8K gal. and 10K gal. cars were used, and a quick perusal of the roster shows that several cars appeared more than once on the A&W during this time.

I created this table for deliveries to Algoma only:

DateContentGalsDestDayLag
06-29Gasoline10285AlgomaFriday-
07-05Gasoline8156AlgomaSaturday7
07-11Fuel Oil8085AlgomaFriday-
07-11Gasoline10285AlgomaFriday6
07-20Gasoline10144AlgomaSunday9
07-25Fuel Oil10071AlgomaFriday14
07-27Gasoline10166AlgomaSunday7
08-03Fuel Oil10177AlgomaSunday9
08-03Gasoline10164AlgomaSunday7
08-15Gasoline10144AlgomaFriday12
08-22Gasoline10090AlgomaFriday7
08-29Gasoline10204AlgomaFriday7

The column labeled day shows the day of the week that the shipment was stamped received by the A&W agent in Sturgeon Bay.  These tended to be on Fridays and Sundays.  I also calculated the lag between shipments of the same commodity (fuel oil or gasoline) and that is tabulated in the last column.  The gasoline shipments tended to arrive 7 days apart, while the fuel oil deliveries were separated by lags of 16 and 9 days.  This table suggests how one could build a demand table for regulating inbound shipments.  

This is the corresponding table for the Forestville distributor:
DateContentGalsDestDayLag
07-02Gasoline8084ForestvilleMonday-
07-05Gasoline10201ForestvilleSaturday3
07-11Gasoline10084ForestvilleFriday6
07-18Gasoline10090ForestvilleFriday7
07-25Gasoline10285ForestvilleFriday7
08-01Gasoline10201ForestvilleFriday7
08-06Gasoline10197ForestvilleWednesday5
08-13Gasoline10177ForestvilleWednesday7
08-17Gasoline10213ForestvilleSunday4
08-22Fuel Oil8138ForestvilleFriday-
08-24Gasoline10201ForestvilleSunday7
There weren't enough deliveries of fuel oil to calculate lags, but for gasoline the shipments seemed to arrive mostly on Fridays, with lags close to seven days.  

This table shows a small slice of UTLX's tank car fleet associated with the Green Bay bulk terminal:


Page 616


MkNoItem#Start#EndNoteMDCarsCapy (lbs)Capy (gals)
UTLX568911012749
TM576780,00010,285
UTLX993111012749
TM576780,00010,197
UTLX1080721012749D1TM163100,00010,084
UTLX1093921012749D1TM163100,00010,090
UTLX22877311800022999
TM184980,0008,156
UTLX24066422400024999
TM765100,00010,071
UTLX32399512580042999
TM5800100,00010,204
UTLX35523512580042999
TM5800100,00010,213
UTLX36190512580042999
TM5800100,00010,201
UTLX39189512580042999
TM5800100,00010,177
UTLX39710512580042999
TM5800100,00010,144
UTLX39734512580042999
TM5800100,00010,166
UTLX40164512580042999
TM5800100,00010,164
UTLX718541167100079999
TM452380,0008,084
UTLX722751167100079999
TM452380,0008,085
UTLX741721167100079999
TM452380,0008,138
There are 16 individual cars for the 23 shipments, and several cars made two or three trips during the two-month period.  The ORER data are from the January 1958 edition (item number, start number, end number, applicable notes, AAR Mechanical Designation, number of cars, and capacity in pounds.  The members of this sample of the UTLX fleet are dominated by 10K UTCC X-3 10K cars, although GATC-built and ACF-built cars were probably also in the sample (UTXL 7100 to 79999; see discussion in http://cnwmodeling.blogspot.com/2013/12/a-prototype-waybill-35.html). 

As we progress further into the fall trains I'll be interested in observing whether the ratio of gasoline to fuel oil shipments changes, as well as the overall frequency of shipments.  

Charles Hostetler and Andy Laurent

Kit Profile - Walthers 75' TTX Flat Car (3950)

$
0
0
This kit profile is for Walthers 75' TTX flat car (Walthers 3950).  The kit was produced in the early 1990s.  It is now out of production but can be found after some searching on the secondary markets.  The particular version I have is undecorated:


Online Resources:

 - General information on PRR F39 class flat cars and some modeling notes:
http://prr.railfan.net/freight/classpage.html?class=F39

-  General information on PRR and TTX F39 flat cars:
http://www.mountvernonshops.com/F39.html

-  Mont Switzer's article on upgrading and detailing the Walthers kit to an ATTX prototype (which also contains a lot of useful information and techniques for modeling the TTX F39s):
http://www.trainlife.com/magazines/pages/31/2289/july-2007-page-49


Offline Resources:

Gatewood & Buchan, 2009, Pennsylvania Railroad Flat Cars:  Revenue & Work Equipment, 1881 to 1968
Switzer, Mainline Modeler July 2005 page 22, F39A Piggyback FlatCar, Trailer Train Company
Switzer, Mainline Modeler August 2005 page 56, F39 Piggyback Flat, Part Two
Keating & Panza, RMC July 1990 page 60, Pennsy's Truc-Train F39A


January 1958 ORER Information:

The January 1958 ORER lists F39s in 7 items under Trailer Train Company.  The cars all carried FC mechanical designations and TTX markings:


StartEndClassNumber
470400470599F39200
470600470749F39a150
470750470799F39b50
470800470899F39a100
470900470909F39b10
470910470929F39a20
470930471229F39c300

The dimensional data were:
IL 75'
IW 8' 10"
OL 75' 8"
EW 10' 8"
EH 8' 4" (except 470900 to 470909 and 470910 to 470929 were listed as 7')
Capacity  716 square feet, 125,000 lbs.

The Home Points were listed as:

For the Pennsylvania R.R. System:
Chicago Ill.
Cleveland O.
East St. Louis Ill.
Kearny N.J.
Pittsburgh Pa.

For the Norfolk & Western Ry. System:
Bristol Va.
Roanoke Va.
Winston-Salem N.C.

For the Missouri-Kansas-Texas R.R. Co.:
Dallas Tex.
Houston (Eureka Yard) Tex.
Kansas City (Glen Park Yard) Mo.
Oklahoma City Okla.
Parsons Kans.
St. Louis (Baden Yard) Mo.

For the Missouri Pacific R.R. Co.:
Houston Tex.
Little Rock Ark.
St. Louis Mo.

For the St. Louis-San Francisco Ry. Co.:
St. Louis Mo.

For the Boston & Maine R.R.:
Boston Mass.

For the Chicago Burlington & Quincy R.R.
Chicago Ill.
Council Bluffs Ia.
East St. Louis Ill.
Kansas City Mo.
Minneapolis Minn.
St. Louis Mo.
St. Paul Minn.

For the Wabash R.R.:
Buffalo N.Y.
Chicago Ill.
Detroit Mich.
St. Louis Mo.


The Kit:

The kit is comprised mostly of injection-molded styrene with fairly thick and brittle castings.  The parts count is under 50; the kit was designed for simplicity of construction rather than for fidelity to prototype detail and fine-scale reproduction of detail.  In this photograph, the black sprue at upper left contains the parts for the ACF-design trailer hitch while the yellow sprues contain the parts for the car itself:


This photograph shows the molded on coupler pocket on the underside of the car.  Modifications will be necessary to install scale-width draft gear:


This photograph shows the side rails, the cast-on hand brake stand, and the cast-on stirrup step and grab iron (Mont Switzer recommends removing the latter three items):


The car deck is actually pretty nice with the exposed centersill and bolster and reasonable texture on the wood planking, although the end detail needs extensive rework per Switzer's article:

The trucks provided with the kit are a roller-bearing design (not discussed in Hendrickson's handout):


I plan on finishing this kit as a TTX F39a using the upgrading techniques described by Switzer.  With  two 35' trailers and an ACF Model A hitch (http://www.trainlife.com/magazines/pages/227/16727/may-2001-page-25) this car should make a really nice late-1957 time marker.

Charles Hostetler
Goshen, Ind.

Kit Profile - Yarmouth Model Works 101 (CP 223950 Series Plywood-Sheathed Box Car)

$
0
0
When I started this series my intent was to take a look at some of the earlier injection-molded styrene kits (they all seem to be "earlier" now!).  Even though a number of these kits are out of production they can often be found on the secondary markets, and I thought it would be interesting to develop a reference that would provide insight into what these kits could become.  The focus was on describing the contents of the box, and making connections between those contents and specific prototypes that I wanted to model.

This post is a little different in several ways.  The prototype is very specific, and a little obscure; the reference materials are very limited.  The kit is a new offering.  The kit is not based primarily on injection molded styrene and offers the chance to work with a variety of materials.  So instead of connecting the kit with plausible prototypes I'm going to try and give the reader a feel for the complexity and multiplicity of materials inside the box which is a big part of the appeal of this kit in my view.

The kit is Yamouth Model Works 101, which represents the plywood-sheathed box cars in CP 223950 to 224449 (http://www.yarmouthmodelworks.com/kits.php; third entry down).  In the January 1958 ORER 485 cars were listed.  The dimensional data were:
IL  40' 6"
IW  9' 2"
IH  10'
OL  41' 9"
EW 10' 8"
EH  14' 7"
Door Opening  6' by 9' 5"
Capacity  3715 cu. ft., 93,000 lbs.

Reference Materials:

Wider (2011) "Mid-Century Composite Box Cars, Late Wood-sheathed Anachronisms".  Railway Prototype Cylcopedia Volume 23, page 39.

http://www.nakina.net/cp/cp2.html (roster data)

The resin freight car discussion group is considering a group build of these cars and that list should be a good resource any questions that arise during the construction process.


Did these cars visit the U.S.?

The cars were were in general purpose use and designated XM.  Because of their wood-sheathed design they were considered to have good protection for the lading.  When new (and in all of the photos I have seen of cars in this series) they carried the lettering "TO BE USED EXCLUSIVELY FOR NEWSPRINT PAPER FLOUR AND SUGAR OR HIGH CLASS MERCHANDISE".  I looked at the deliveries of some "clean" commodities from Canada to the U.S. using the Canadian-Mexican Supplement that contains data from 1951 through 1953.  The average carloads per year for several clean commodities to various states are shown in this table:


from Canada to:Flour, WheatNewsprintSugarFood Products
Alabama
100

Arizona
333

Arkansas
333

California
60033
Colorado
900

Connecticut
2400

Delaware
400

D.C.
1267

Florida
133

Georgia
633

Illinois
10667
200
Indiana
3567

Iowa
2267

Kansas
1567
33
Kentucky
2467

Louisiana6767

Maine100100

Maryland
1967
33
Massachusetts1004433
33
Michigan
4667

Minnesota
3800
67
Mississippi
267

Missouri
5233

Montana
67

Nebraska
1567

New Hampshire
33

New Jersey14336567
167
New Mexico
167

New York12002076733167
North Carolina
467

North Dakota
200

Ohio
9967

Oklahoma
533

Oregon
200

Pennsylvania
11867
33
Rhode Island
300

South Carolina
267

South Dakota
167

Tennessee
2200
33
Texas
1367
133
Utah
233

Vermont
133

Virginia
867
67
Washington3367
33
West Virginia
1167

Wisconsin
2167
33
Wyoming
33


Total2933109533671033

Although there were only 500 of these cars built, when they were relatively new and tight they were probably concentrated in services carrying loads that went to a number of U.S. states with reasonably high frequencies.  Since newsprint and food products came into Milwaukee through the Port of Milwaukee very frequently, I think this car makes a plausible model for my location during late 1957.  In the 1960s, these cars were getting on in age, a number of them were converted into stock cars, and the remaining cars were probably in grain service.  In this era I would guess they visited the U.S. a lot less frequently.


The Kit:

This is a multimedia kit, which to me is part of its appeal.  The part count is over 160, and the materials include cast resin, injection-molded styrene, etched metal, laser cut wood, and wire.  The major body components are the one-piece body (sides/ends/roof) and the floor.  They are cast in resin, and my castings had a really nice finish.  The next two photos (click to enlarge) show the two major components along with the doors and some of the underframe component castings:


Other parts are packaged separately (top plastic bag in this view) which will be discussed in more detail below.  There is also an injection-molded styrene brake set (the Tichy sprue at lower left) and a decal set from Black Cat Decals (lower right):


In addition to the underframe components shown above, additional resin castings are supplied for tack boards and route card boards as well as a brake retainer.  Those of us that use Accurail ProtoHO couplers will have a little extra modification to do on the under frame:


Laser-cut wood for the running boards and lateral running boards are quite thin and precisely cut:


These are the etched metal frets for the ladder stiles (left), stirrup steps and running board supports (top center), brake platform support, eyebolts, and lateral running board supports (bottom center), and brake platform (right):


The trucks included with the kit are Tahoe Model Works ARA Cast Steel with Spring Planks and Barber Lateral Motion Devices.  They come with separate brake shoe castings.  If you bought them separately they would be TMW 109/209 depending on the wheels:


I'm hoping that the Resin Modelers group build comes off, and looking forward to the challenges of construction of this car - I think I will learn a lot!

Charles Hostetler
Goshen, Ind.

HMs with 30' 6" IL

$
0
0
On the STMFC regarding the USRA twin hoppers, David Thompson wrote in part:

"The inside length of 30'6" was also uncommon, and is a good way to spot them in ORERs."

This list is all of the cars in revenue service from the January 1958 ORER filtered to show only HM cars of 30' 6" IL.  


PageItemMarkingAAR MDTotal#Start#EndILCuFt (Gal)Capy (lbs)
4251L&NHM456918000018599930.51880100,000
4113L&NHM1505270002899930.51880100,000
13847P&LEHM1358370003841830.51980110,000
1452RDGHM1277725007449930.51880110,000
3111CRRHM1209437504549930.51880110,000
4224L&NHM1066856508799930.51880100,000
2971SLSFHM956880008949930.51974110,000
5325C&IRRHM9433400439930.51880110,000
18814D&HHM8573221420030.51880110,000
1566B&OHM84832000032099930.51880100,000
15614B&OHM83932400032499830.51880100,000
11841NYCHM80086100086199930.52055110,000
11837NYCHM76086000086099930.52055110,000
4226L&NHM756890008999930.51880100,000
4214L&NHM755750007599930.51880100,000
15764B&OHM69472600072679830.51880100,000
1567B&OHM50432100032159930.51880100,000
24711MHM486170001749930.51880110,000
26316P&WVHM4625000546230.51880110,000
660B1IHCXHM44420170030.51880100,000
14843CNJHM366650916549930.51880110,000
11825NYCHM33484450084549930.51880110,000
15137B&OHM32423310023349630.51880100,000
2614INTHM318150001532130.51880100,000
2644DT&IHM2941300159930.51880100,000
5336C&SHM290180001829930.51880110,000
3265CGHM280210012130030.51880100,000
11831NYCHM26584800084897830.51880110,000
15611B&OHM25332160032189930.51880100,000
51915MPHM247580005874930.51940110,000
15662B&OHM24442600042629930.51880100,000
24636ACYHM2007000719930.51880100,000
11826NYCHM18784600084799930.51880110,000
24222ACHM1796601678030.51725140,000
15141B&OHM16823350023369930.51880100,000
11822NYCHM14884000084199930.51880110,000
11817NYCHM14183700083849930.51880110,000
51914MPHM136580005874930.51880110,000
454NC&StLHM125470004722430.51880100,000
11824NYCHM12084300084374930.51880110,000
2935C&EIHM108970009726030.51880110,000
2821RIHM105898958999930.51974100,000
32ACLHM103801428029630.51880100,000
11813NYCHM8183100083199930.51880110,000
11815NYCHM8083300083399930.51880110,000
2473MHM5960069930.51880100,000
11836NYCHM5485030085039930.51880110,000
11821NYCHM5383920083969930.51880110,000
11814NYCHM5283210083259930.51880110,000
2955GAHM51210002105130.51880100,000
3302SLBEHM496600664930.51880100,000
7312RFPHM483506355530.51880100,000
6424TCHM489000910030.51880100,000
281A&WPHM46310003105430.51880100,000
24917NKPHM46990009944930.51880100,000
11816NYCHM4283450083499930.51880110,000
2831WofAHM40110001104430.51880100,000
11834NYCHM3685000085009930.51880110,000
27317AAHM34305003059930.51880100,000
7313RFPHM303561359030.51880100,000
19816RSHM3084086930.51880110,000
6425TCHM309150917930.51880100,000
26314P&WVHM293000399930.51880110,000
1253P&EHM283362339830.52055110,000
40554NPHM26700007004830.51880100,000
282A&WPHM25311003112430.51880100,000
60451PCCXHM256401642530.51880100,000
3304SLBEHM256700672430.51880100,000
11832NYCHM2384950084954830.51880110,000
60453PCCXHM206725674430.51880100,000
16552DL&WHM18811458179930.51880100,000
4135TNHM1871273030.51880100,000
2681D&TSHM141209127830.51880110,000
5517C&OHM1230050030051130.51880100,000
3303SLBEHM126650666230.51880100,000
38426M&StLHM11650016535530.51880100,000
11833NYCHM984984384989930.51880110,000
674A3PDSXHM720020630.51880110,000
674A4PDSXHM630130630.51880110,000
883PRRHM622000022029930.51880100,000
14838CNJHM5650006500930.51880110,000
19052NHHM511500011554530.51880110,000
60452PCCXHM56426643030.51950100,000
674A5PDSXHM430731030.51880110,000
6423TCHM48900890330.51880100,000
26216B&LEHM3435014400030.51880100,000
16551DL&WHM3810008101930.51880100,000
18815D&HHM23221420030.51940110,000
451NC&StLHM2462004623430.51880100,000
41812CRWHM1109101091030.51880100,000
2477MHM11500001549930.51880110,000
38425M&StLHM1633756337530.51880100,000
11823NYCHM184298884299930.51880110,000
11835NYCHM185014185014130.51982110,000
26312P&WVHM12196219630.51880110,000
26313P&WVHM12652265230.51880110,000
4215L&NHM0760007612030.51880100,000

Charles Hostetler
Moriarty NM

Recent Car Competition and Selection Puzzle - 1

$
0
0
Introduction

Jim Dick recently started a thread on the STMFC that involved a car competition and selection puzzle.  The statement of the puzzle can be found in STMFC 124063, three supporting documents are in the STFMC Files, and the solution and some explanatory material can be found in STMFC 124243.  I enjoyed the puzzle quite a bit and this post (the first of a two-part series) contains some of the things I learned by working through it.

The puzzle says that you are a B&O yardmaster in St. Louis and need to select 12 cars for loading from a list of 20 empty cars that happen to be in your yard that particular day.  The 12 destination cities are provided, together with the routings (all of the routes start on the B&O, so the implication is that the loading site is serviced by the B&O and that the B&O will be the originating line-haul carrier).  The 20 cars are identified by railroad only, and a further inference can be drawn that these are all ordinary box cars in general service with no other distinguishing characteristics to differentiate them.  The key statement in the puzzle is "Loaded in accordance to Car Service Rules, there will be no empty mileage involved in placing cars on owners rails upon release." Jim also provided 1953 versions of the map showing the AAR Car Selection Chart Showing Home Districts for All Principal Freight Car Ownerships as well as the list headed Principles to Govern Car Selection (In Order of Preference).


Importance of Car Competition and Selection

To me, the issues raised by the puzzle are important for two reasons.  The first is that understanding this process can help create more plausible model waybills.  The second is that the car competition and selection process is an essential element in understanding the freight car distribution problem.

Plausible Model Waybills

My attention was drawn to this puzzle because it relates to one of my major modeling interests, writing model waybills that plausibly reproduce real-world railroad commodity flows through the Port of Milwaukee.  It turns out that there is no waybill collection or car ferry manifest or other relevant documentation from my period of interest (September and October 1957) so I undertook to try to develop more general methods.

The ICC 1% Carload Waybill Survey and some basic data from Port of Milwaukee historical statistics provide a reasonably detailed look at the number of carloads of different commodities passing through the port, the basic types of freight cars used to transport those commodities, and the states of origin and destination.  The additional information needed to write model waybills is the specific car that is used for each shipment.  For example, I can estimate with reasonable accuracy the frequency at which box cars arrived in 1957 at the Port's Transit Shed 1, loaded with furnaces for export from the Mount Vernon Furnace & Manufacturing Co. in Mount Vernon, Ill.  This facility was served by the Chicago & Eastern Illinois, and its also easy to generate a plausible route:

CEI - Chicago (via BRC or BOCT) - CNW - Milwaukee.

This is an aerial view of the plant taken in April, 1963 (click to enlarge):


So when the shipment from this facility is drawn and its time to model the car and the waybill, what box car should the shipment come in?

The Freight Car Distribution Problem

It turns out that the car competition and selection process is also at the heart of the freight car distribution problem.  I view this as an interesting intellectual challenge somewhat separate from the practicalities of the modeling process.  The challenge is to take the historical statistics that we have available to us, and make interesting and plausible deductions about the distribution of the freight car fleet.

In my blog series on the travels of Rutland 197, an ordinary general service box car, I showed that the car competition and selection process was the primary factor in determining the individual steps of any box car along its travels and thus its long term behavior.  I developed two simple algorithms to model the car competition and selection process (discussed in more detail in the second part of this post) and showed how these algorithms could be used to calculate the long-term average spatial distribution of any box car.  Although promising and quite flexible, the problems with that work (in my view) were that the algorithms weren't very satisfying and that the calculations were a bit tedious.  Hence I've been on the lookout for different ways to think about the car competition and selection process and better algorithms.  


Working Backward from the Answer

I'll be quite frank and state right up front that I didn't get the "textbook" answer.  One of the things reinforced in my mind by this puzzle was that there are many factors involved in the car competition and selection process.  The puzzle writer was trying to emphasize the importance of minimizing total empty miles for ALL of the cars, both loads and empties (probably as a teaching tool).  I was able to work backward from the provided solution to understand how the "textbook" answer was achieved.

To work backward I used the problem description, the Official Guide (March 1957), and the Official Railway Equipment Register (January 1958).  I didn't really need the AAR Car Selection Chart or Principles.  

The first thing I did was use the OG and ORER to confirm the location of the B&O.  I had a vague memory that the B&O freight facilities were in East St. Louis Ill. rather than in St. Louis Mo. and this turned out to be correct.  Doug Harding also noted in his STFMC post that the puzzle was geographically challenged by this fact.  In this March 1968 aerial photo you can see that the B&O yard in East St. Louis is a small stub end yard terminating to the west at the Mississippi River:
The outgoing freight house is just to the south of the stub end yard, and just a part of the CB&Q's East St. Louis yard is visible to the northeast of the B&O.  The TRRA gateway to Saint Louis (the Eads Bridge is just to the south of this area.  This map from the TRRA's entry in the OG shows the overall layout:

Then I looked at the B&O Freight Connections and Junction Points in the ORER and found that the B&O had interchanges with 8 of the railroads present in the list of the available 20 empty cars:


BO Interchanges
CBQEast St. Louis
CNJ-
CO-
DH-
DRGW-
ERIE-
LNEast St. Louis
MPEast St. Louis (St. Louis via A&S or TRRA)
MStL-
NH-
NP-
NYC East St. Louis (via TRRA) [CCC&St.L]
PRR East St. Louis (via A&S or TRRA)
RDG-
RI East St. Louis (via TRRA)
SAL-
SOUEast St. Louis
UP-
WP-


Of course, the difference between the 20 available empties and the 8 interchanges in the area is 12, which is the number of cars available for loading if the empties from the 8 direct interchanges are returned empty and not used for loads.  And since the puzzle requires 12 cars to be loaded, I felt like I was onto understanding something about the puzzle at this point.

Next I made this matrix, which I called the "At Home Table":


At Home Table


CityBOCBQCNJCODHDRGWERIELNMPMStLNHNPNYCPRRRDGRISALSOUUPWP
Albany


Bethlehem


Billings


Buffalo


Butte


Cincinnati


New York


Philadelphia


Pueblo


Richmond


Saint Paul


Salt Lake City


Ignore the color coding for just a moment.  The destination cities are listed down the left side and the 20 different railroads representing the available empties are listed across the top.  Going across each row, I placed a check mark in each railroad's column if the railroad served that destination city.  For example, Albany NY is served by the DH and NYC (data obtained from the OG).

Next I colored the squares red for the 8 cars that were returned empty by interchange in either St. Louis or East St. Louis to indicate they were not available for loading.  After studying this table for a bit, I noticed that there were now several cities that now had only 1 home road car available (i.e., only one check mark remaining in the row that was not red).  These were Albany, Billings, Philadelphia, and Pueblo.  I assigned the only remaining choice for loading for each of those destinations and indicated that assignment by coloring the cell light blue.  Then the matrix structure showed quite clearly that for a few more of the remaining cities (Bethlehem, Butte, Saint Paul, and Salt Lake City) after removing the red and light blue boxes from consideration, there was only a single choice remaining, and I indicated those selections in darker blue.

At this point, I had assigned 8 cars to be returned empty to via connections near Saint Louis, and 8 cars (in two steps) with only a single choice where they could be released to their home rails directly after they reached their respective destinations.  That left 4 destinations and four cars:

Buffalo:  either CO or ERIE is at home here
Cincinnati:  either CO or ERIE is at home here
New York:  either ERIE or NH is at home here
Richmond:  either CO or SAL is at home here

I reasoned that if I used ERIE for New York, or CO for Richmond, that no car would be at home for either Buffalo or Cincinnati.  So I assigned NH to New York, and SAL to Richmond.  That leaves the CO and ERIE cars for Buffalo and Cincinnati, and it really doesn't matter because both cars are home at either destination.

So in retrospect, the textbook answer to the puzzle can be obtained by eliminating from consideration for loading all of the empties that can be returned by direct connection, and by working through a set of relatively simple steps of elimination.

In the second part of this series (next post) I'll continue with my analysis of the puzzle, some descriptions of other algorithms and the answers they provide, and some new car competition and selection puzzles.

Charles Hostetler
Goshen, Ind.


Recent Car Competition and Selection Puzzle - 2

$
0
0
This is the second part of a two-post series discussing the recent car selection puzzle posted by Jim Dick.  In the first part of this series (previous post) I discussed some of the reasons I think car selection is interesting and important and how I "reverse engineered" the textbook solution.  In this post I'm going to discuss some observations about the puzzle, some other answers I came up with, and pose some additional car selection problems.

Observations on the Puzzle

One of the things I liked about the puzzle was that it talked about car selection in the context of making multiple choices.  One of my first attempts to develop a car selection algorithm was documented in a series of blog posts I wrote about 2 years ago - I called it CarClerk.  CarClerk was a computer program that looked at a list of empty cars (the length of the list was set by the user) and applied the AAR Car Selection preferences to select a single most appropriate car for loading.  The algorithm was quite successful in that it was easy to code and understand, and it did show that when a single selection was made from a randomly generated list of cars that was reasonably large (e.g., 5 to 10 empty cars) that the probabilities were highly in favor of selecting a car for loading that was to a Home District.  Under these conditions, that shipment of furnaces from the Mount Vernon Furnace & Manufacturing Company to Transit Shed 1 in the Port of Milwaukee (that I briefly discussed in the previous post) would most likely be in a car that was at Home in District 11 (e.g., CNW, MILW, SOO, GBW, etc.; rather than CEI, LN, MP, or Southern, which are on home rails in Mount Vernon).  When there is a lot of choice, the AAR car selection preferences are very good at sending general service cars toward their Home Districts.  The problem with this line of thinking is that in general, the car clerk or yardmaster or whomever is making the selections usually is not making a single choice from a list of 10 possibilities.  Jim's puzzle points out that the more typical case is making multiple choices from a rather limited list and I think that is important to remember.

How accurately does the puzzle portray the car selection problem for the East Saint Louis yardmaster?  The East St. Louis yard is at the west end of the B&O main line from Cincinnati.  The B&O Freight House and Freight Forwarding Station discussed in the puzzle were the only rail shippers served by the B&O in East St. Louis, and except for a few grain elevators, a quick survey suggests to me that there were only two other major shippers between East St. Louis and Flora Ill. (which I think might have been the next division point, about 93 miles eastward).  There was a stove manufacturing plant in O' Fallon Ill. about 15 miles east of East St. Louis and a paper mill in Carlyle Ill.  (about 45 miles eastward).  Both of these may have required some empty cars periodically, and of course the grain elevators would have needed some empties during the grain rush, but it is quite possible that the major day to day concern (with respect to empty cars) of the East St. Louis yardmaster was supplying empties to the freight house and forwarding station and routing other empties to the direct connecting carriers in the area.  In this respect I would speculate that the puzzle is a pretty close approximation to real life.  Where it may be a somewhat less accurate representation is in the number of empties available relative to the number needed for loading.  From the ICC 1% Carload Waybill Survey I estimate that in 1957 Illinois originated about 830,000 carloads in general service box cars and terminated about 670,000.  In Missouri the estimates are 310,000 originations and 360,000 terminations.  So in these two states the supply of available empties was relatively tight (1.25 loads for every empty in Illinois and 0.9 loads for every empty in Missouri).  In the puzzle there were 12 loads and 20 empties, a ratio of about 0.6.  I offer the suggestion that in developing the puzzle's focus on minimizing total empty car miles the author didn't portray the relatively high demand for empties that faced the East St. Louis yardmaster on any average day.  Something like 12 empties from which to choose 12 loads might have been more typical.

I also thought a little about the distribution of empty cars that were provided by the author.  Of course he/she generated that list so that there was a single, clearly optimal solution.  But in the real world the cars available to the East St. Louis yardmaster for loading were those that had just made deliveries to the freight house or happened to be returning empty through the yard (passed on by the 8 connecting lines in the area).  I've looked at a lot of lists of 20 cars drawn randomly from all types of distributions and two things pop out at me - the list in the puzzle only contains a single B&O car, and it doesn't contain any multiples (i.e., two empties from the same railroad).  Both of these characteristics are highly unusual in a random selection of 20 cars.

The final thing I want to remark on is that while this puzzle was highly illustrative in demonstrating the importance of minimizing empty miles for all of the cars, it doesn't address other important aspects of both the AAR Car Selection Preferences and the Code of Car Service Rules.  For example, it seems clear to me that it was considered highly desirable to load foreign cars via owner roads.  This allows carriers to participate in the freight rate for the shipment.  As examples, the textbook answer does not favor loading the CNJ car to New York even though the car is routed over the CNJ, the RDG car to Bethlehem even though the car is routed over the Reading, and the NP car to Butte even though the car is routed over the NP.  In the search for a single clear-cut answer I think the author of the puzzle lost a lot of the sense of compromise and adjustment that faced real-world yardmasters.  Also missing is a sense of the amount of time and effort that might have been available to devote to this problem.  It seems to me that there must have been times when the freight house was yelling for cars for loading RIGHT NOW!, the empties were coming in in dribs and drabs from local connections and the train from Flora is running late, its cold and raining and near the end of the shift, and there's mechanical trouble with several of the cars anyway.  Under these conditions, I doubt I would be able to set everything else aside, sit down for 10 minutes and work out the textbook solution to this problem, and minimize the total empty mileage (but then I might not have made a very good yardmaster :)


Some Other Solutions to the Puzzle

One of the car selection algorithms I developed for the Universal Box Car series of posts is called LineUp.  The available empties were lined up in any convenient order (I used a random number generator) and as many cars as needed for loading were selected from the top of the list down.   LineUp has the advantages that it is really easy to program and quick to run.  It also has the attribute of circularity, which I think is important.  Circularity means that the outputs from the car selection process are completely consistent with the inputs.  The disadvantage of LineUp is that it totally ignores the car selection preferences and the Code of Car Service Rules.  In the Box Car Travels series I used LineUp in cases where there was a great deficit of empty cars relative to the demand.

Another algorithm that I examined in the Universal Box Car posts is called EasyAAR.  EasyAAR has the single goal of maximizing the number of shipments that are loaded in cars to their Home District, toward their Home District, or to a District adjacent to their Home District (in that order).  EasyAAR has the advantage that it simulates a bit of the real car selection process.  Its disadvantages are that it is hard to understand and explain, it can get stuck in false maxima, and it totally ignores the cost of the empty mileage for the cars that weren't selected for loading.

I developed a new algorithm when I was trying to solve Jim's puzzle.  It is called Rule2and3.  It looks at the routings to see whether the owners of any of the available empties participate in the line haul, and assigns those loads.  It then tries to get the remainder to their Home Districts, and for any that are left over it just randomly assigns cars from the remaining empties.  It clearly favors routing foreign cars by their owner roads whenever possible.  

The solutions to the puzzle from these algorithms are compared to the textbook example in this table:


“Textbook”LineUpEasyAARRule2and3
CityCarCarCarCar
AlbanyDHERIERDGNYC
BethlehemCNJRIERIERDG
BillingsNPDHNPCBQ
BuffaloERIENPNYCDH
ButteUPPRRUPNP
CincinnatiCOSALCOSOU
New YorkNHWPDHCNJ
PhiladelphiaRDGCOCNJERIE
PuebloDRGWNHDRGWMP
RichmondSALBOSALCO
Saint PaulMStLCBQMStLMStL
Salt Lake CityWPUPWPDRGW


UnusedBOCNJBOBO

CBQDRGWCBQLN

LNLNLNNH

MPMPMPPRR

NYCMStLNHRI

PRRNYCPRRSAL

RIRDGRIUP

SOUSOUSOUWP


Total Score231411

The row labeled total score is a rough indicator of the quality of the outcome.  It is the sum of the differences between the final locations of their cars relative to their Home Districts.  Bigger numbers mean more cars farther from home.  It was calculated using the AAR Districts as represented in the Jan. 1958 ORER.  For example, the textbook answer has the UP car in Butte, which is one district away from its closest Home District, and NH in New York, which is also one away from home, for a total of 2.  The total score does not measure the virtue of routing a foreign car via owner rails, which probably is a bit unfair to the Rule2And3 algorithm.  

That score of 31 for LineUp looks pretty bad, but when you consider a difference of 31 districts divided among 20 cars that means that the average car is only a district and a half away from home, which doesn't seem too terribly awful for an algorithm with no knowledge of the car selection preferences or Home Districts.  Clearly an occasional (or more than occasional) less than optimum selection done under stress isn't going to ruin the whole system.  


An Additional Puzzle

I've developed a few additional puzzles to explore these ideas and test algorithms.  This is not a contest, it is a learning experience.  I have no right or wrong answers - the important thing to me is to explore what situations might have faced a real operator in order to write better model waybills and inform better car selection algorithms.  Any clarifying questions, comments, and discussion are welcome.  I'll roll this one out first and see whether it generates any interest, and then publish the other ones as time permits over the next month or so.  

You are the yardmaster at CNW's National Ave. Yard in Milwaukee.  At the start of your shift you get a call from Transit Shed 1 - an important customer.  He needs 10 empties right away for time-sensitive cargo unloaded from an ocean-going ship that just made an unscheduled call at the Port.  The cargo will clear customs and be released for loading in three hours.  Fortunately, you have a few more empties on hand than normal and a SOO freight has just transferred a bunch of empties that were bound for Jones Island anyway to be returned to the C&O via car ferry.  

The 10 destinations are:
Waltham Mass., on the Boston & Maine
Grand Rapids Mich., on the C&O
Sheboygan Wisc., on the C&NW
Hannibal Mo. on the Wabash
East Peoria Ill., on the Toledo, Peoria, & Western
Bridgeport Conn., on the NH
Green Bay Wisc., on the C&NW
Shreveport La., on the KCS
Topeka Kans., on the ATSF
Stockton Calif.  on the SP

The shipper has expressed no preference as to routing for any of the shipments.  

The 15 empties of type XM that you have available are:
Car
C&O
C&O
C&O
C&O
CNW
CNW
CNW
CNW
GMO
MEC
MP
MP
NYC
SA
SP
All of these cars are ordinary 40' box cars except one of the MP cars is in MP 87000 to 87249 which is 50' in length.  (No I don't think that makes any difference in this case).

You have direct interchange in Milwaukee with the Milwaukee Road, SOO, the C&O (via car ferry), and the Grand Trunk Western (via car ferry).  

Provide car selections, routes, and (most importantly) your rationale!

Charles Hostetler
Goshen, Ind.

Car Competition and Selection - Questions and Some Answers

$
0
0
I've received several proposed solutions to the Port of Milwaukee car competition puzzle I posted recently.  I'll discuss them in an upcoming post toward the end of the week.  Just as important to me at least, I've received some interesting questions and discussion related to the problem that I think are worth sharing and that's what this post is about.

1)  What reference materials would help build a basic understanding of freight car distribution?

 In my view there are two main branches to the subject of freight car distribution.  The first branch deals with the process of freight car distribution as practiced by the prototype; how empties are selected, how loads are handled, the paperwork that is used to guide and document the process, and so forth.  The second branch deals (observationally or theoretically) with the outcomes and describes how freight cars were (or may have been) distributed across the North American rail network.

First Branch (Process):

-  This is a link to Tony Thompson's article that provides a basic overview of the subject that I refer to quite frequently:

http://www.opsig.org/doff/DOpages/Freight%20Car%20Handling%20new.pdf


- This is a link to a digitized version of E. W. Coughlin's book "Freight Car Distribution and Car Handling in the United States" published in 1956 that I have found quite useful as well:

http://babel.hathitrust.org/cgi/pt?id=mdp.39015006075272;view=1up;seq=1

-  This is a link to a digitized version of L.W. Sagle's book "Freight Cars Rolling" published in 1960 that takes a more visual approach to the subject:

http://babel.hathitrust.org/cgi/pt?id=mdp.39015000449929;view=1up;seq=1

-  I find "The Freight Traffic Red Book" a very useful resource covering all aspects of freight transportation, including a number of ICC rulings and associated commentary.  The only drawback of this reference is that the induing is relatively poor and it takes a while to learn your way around this book. From 1920 through 1950 it was published yearly but in the post war years the editions became much more infrequent.  I got my hard copy (1955 edition) from a used book store but the 1920 edition is available online at:

http://books.google.com/books/about/The_Freight_Traffic_Red_Book.html?id=qRopAAAAYAAJ

-  The editorial section of the Official Railway Equipment Register contains the text of the Association of American Railroads (I use the January 1958 edition to cover the fourth quarter of 1957):

  1. Car Service and Per Diem Agreement
  2. Code Of Car Service Rules - Freight (including the Car Selection Chart and associated list of preferences and Home Districts)
  3. Code of Per Diem Rules - Freight (including the three Appendices) 
  4. Circular CSD-87 (and 4 Appendices) which deals with embargoes
I think the information to understand what processes the railroads were using to manage freight cars and the goals they were trying to accomplish is readily available.  


2)  Second Branch (Outcomes):

Unfortunately reference material dealing with the second branch of freight car distribution (how freight cars were actually distributed across the North American rail network) is much less available, and in fact accounts of reliable and detailed studies are practically nonexistent.  The number of classes of distinct geographic locales, commodities, car types, and carriers are very large.  The mathematics associated with the problem are combinatorial and most of the associated calculations have a property called NP-completeness that makes them very difficult to solve even with the fastest computers (if you are interested, Keith Devlin's "The Millennium Problems" contains a really good discussion of why these problems are so hard to solve).  Our memories are imperfect and selective.  The data required to calibrate and check hypotheses and models just don't exist for the most interesting historical questions about prototype freight car distribution.  Were the Vendome tank cars mostly found in Kansas and Oklahoma?  How frequently would a VENX car be found in Milwaukee in 1957?  Would the answers be different in 1947?  Were Rutland boxcars really found as frequently in New England as Texas?  There aren't readily available references that address these types of questions.  

-  The Introduction (Chapter 1) to Kline and Culotta (2006) "The Postwar Freight Car Fleet" is one reference that successfully addresses two high-order freight car distribution questions.  This book deals with 350 of the 520 freight car photos taken primarily in 1947 (most of the rest were taken in 1946 and 1948) so the time period is satisfactorily short.  Most of the photos were taken in the Harrisburg, Pennsylvania area, so the geographic extent is satisfactorily narrow.  The authors were able to show that the distribution of the 350 selected cars, when grouped into the major AAR mechanical designations (X, H {including LO}, G, T, R, S, and F), were "reasonably representative of the distribution of car types in the U.S. freight car fleet during the time when the photos were taken." Kline and Culotta also looked at the distribution of freight car age and showed that the "age distribution for the cars in this book is representative of the age distribution of the U.S. freight car fleet at the time the photos were taken." And if you do a basic analysis of the likely sampling error it turns out that the distribution of car types in the photo collection and the distribution of car ages in the photo collection do match the comparison standards that Kline and Culotta provided within sampling error.  So at least near Harrisburg Pennsylvania in the late 1940s we can probably draw two very high order inferences about freight car distribution if the photographer wasn't biased in the cars he selected to photograph.  But it is clear that the sample size to address any of the more detailed questions (such as I posed above) for other locales and for other time periods just isn't available in a sample size that numbers 350 (or several thousand for that matter).  

-  The only waybill collection I am aware of that is large enough to support detailed statistical analysis is the Ahnapee & Western Railway Company collection that Andy Laurent and I have been blogging about.  I estimate that there are about 60,000 waybills in this collection, all taken from inbound freight shipments to the A&W between 1962 and 1965.  We are slowly working through this collection, and it might be large enough to draw some statistical conclusions about freight car distribution.  The issues are the speed at which we are able to plow through the data (Andy has been quite prompt at providing the scans and detailed review of the posts, but in the ado and commotion associated with finding a new job and moving I have fallen way behind my desired pace) and the fact that the A&W is a small railway, effectively a branch line off of a secondary main whose inbound traffic flow was dominated by a few consignees.  In general, we found that on the A&W in the early 1960s, the incoming general service boxcars appeared at frequencies somewhat different than their frequencies in the national freight car fleet, that the characteristics of these free-rolling boxcars were somewhat different that the national fleet, and that home road cars were used to ship to foreign road destinations much more frequently than we expected.  Our blog posts on cumulative statistics can be found here:


and they will be updated as the number of waybills that we have analyzed increases and the counting statistics get better.  

-  Tim Gilbert and Dave Nelson used ICC reports and other data and deduced that the population of general service foreign road cars was well mixed, and (with a few stated exceptions) the distribution of these cars at a particular location tended to look like the distribution of the national fleet. Unfortunately a complete description of the data sources and deductive reasoning has not been published (at least to my knowledge).  So it is rather difficult to understand in detail what they did and what the statistical limitations are.  However, if you search the STMFC archives (by author, using the advanced search feature) you can find a number of lively discussions about their work.  

-  I've been able to make one original contribution to the literature that I'm really pleased with that can be found in this post:


What I was able to show is that given a world where the car selection rules are not obeyed and car selection is essentially random, the resulting distribution of general service boxcars is well-mixed (consistent with the Gilbert-Nelson observation/deduction) and that the local distribution everywhere matches the proportions in the national fleet.  Now this is a pretty theoretical result because we don't know in the real world whether the car selection rules were obeyed or to what extent.  The importance of this result (in my view) is that I also showed how to estimate what that distribution looked like from state to state using the 1% Carload Waybill statistics statistics, and how it could be used as a comparison standard for Monte Carlo simulations.  


2)  What is a Transit Shed anyway and how did it work?

A transit shed is a secure enclosed building where imported or exported goods can be transferred between a ship and freight cars/trucks.  Inside the shed, which is typically a large open space, the goods can be temporarily stored, inventoried, and pass through customs.  This is a description of Transit Shed 1 at the Port of Milwaukee from a 1949 pamphlet published by the Port (click to enlarge):

Here's a view of the interior after a big load of newsprint was imported:

This view showing the exporting of boxed boat motors was taken from a ship on the dock side of the facility:

And this view shows 7 box cars and a few trucks parked on the north side of the facility:


I don't know exactly how the importing process worked in practice, but I imagine it followed in general outline the process that Tony Thompson discusses in this blog post (which is consistent with the process descriptions in the reference materials listed above):


Specifically, I would imagine that:
  1. The importer or his freight forwarder called the C&NW or MILW Car Distributor (the outer harbor was served by both carriers) and described the loads that were clearing customs, when they would be available, and their destinations.  The freight forwarder may have provided routes for the shipments and maybe even the tariff rates.  
  2. The Car Distributor would identify the empty cars for the loads, and fill out the Bill of Lading.  His clerk would create the waybill for the shipment and the empty car cards needed to move the empties from their current locations to Transit Shed 1 for loading.  
  3. The empty car cards would be delivered to the respective yardmasters and the empties would be blocked and put onto transfers to Jones Island.  
  4. The Bills of Lading and the waybills for the shipments would be delivered to the importer or freight forwarder.  
  5. When the empties showed up at Transit Shed 1 and the lading had cleared customs, the cars would be loaded.  
  6. When the cars were loaded, the loads and waybills were picked up by the next transfer from Jones Island to an appropriate yard in the Milwaukee area, blocked and put on outbound trains.  
There were spaces for about 10 cars on a single track on the loading (north) side of Transit Shed 1.  I imagine that there was a potential for the cars to get mixed up and the commodities loaded onto the wrong car, but I would also guess that this potential had been foreseen and that some mechanism was in place to minimize the potential of misloading.  Perhaps something like this example would work:

where the notations directs the car to Transit Shed 1, to be loaded by National Carloading Corp. (the forwarder) at Door 4.   

Here's how I plan to simulate the process on my layout:
  1. The traffic demand spreadsheet for Transit Shed 1 will generate a random number of loads and consignees from the distributions described by the Port of Milwaukee summary statistics and the 1% Carload Waybill Survey for the operating session.  
  2. Prior to the operating session I'll scan the loads and consignees from all of the sources of traffic on Jones Island and consult my list of available empty cars and make the best assignments I can, filling out the empty car cards and preparing the waybills for the loads.  
  3. The empty cars will be located on the storage shelf and put onto their appropriate staging track.  
  4. The empty car cards will be given to the conductors of the transfer runs during the operating session, who will proceed to deliver them to Transit Shed 1, the Municipal Ferry Dock, and so on.  
  5. For the cars delivered to Transit Shed 1, I'll collect the empty car cards after the session and replace them with the waybills for the outbound shipments.  Then the next session the cars and the waybills will be picked up by the next transfer run and sent off to staging.  

3)  Isn't there a bit of a contradiction between the Code of Car Service Rules and the Gilbert-Nelson observation that foreign road general service freight cars are well mixed?

Well yes there is in my opinion.  I have shown in a series of posts that the Code of Car Service Rules would have been very effective at sending foreign cars back to their home districts in cases where there was a modest degree of choice in the selection of empty cars.  In the absence of other factors, as this process is repeated over and over again the net effect would be to "order" the previously well mixed fleet and cars would tend to spend more time closer to home on the average.  I am aware of three lines of thought to reconcile this contradiction:
  1. Tim Gilbert was of the view that the car service rules "were frequently ignored because to 
    follow them rigidly caused increased operating efficiency." (Gilbert, 2007,  STMFC 60622)
  2. Jeff Aley offered the suggestion that the second preference in the "Load Cars as Follows" might tend to act as a force to send cars far from home.  Imagine a load of manhole covers originating on the East Jordan & Southern that was consigned to California.  The only way off the EJ&S is its interchange with the C&O in Bellaire Mich.  So if an empty C&O car was available, it would be preferred relative to any other car according to preference 2 for this routing:  EJS - BELLAIRE - CHICAGO - CNW - COUNCIL BLUFFS - UP (CNW and UP cars would be also share in this preference).  If enough cars were moved by preference 2 far away from their home districts because they participated in some early portion of the route the net effect would be to mix up the distribution.  In this way of looking at it, the car service rules could be followed and there still may have been a mixing up that would lead to a Gilbert-Nelson result.  
  3. In the boxcar travels series, I used a car selection model where the car service rules were used in places where the empty supply exceeded the demand (as calculated from 1% Carload Waybill Survey statistics) and a random selection was used in places where there was a deficit of empties.  This view sort of gives the railroads credit for following the rules when they could, but doing whatever it takes to protect the load when empties are hard to come by.  This resulted in a distribution for the boxcar I simulated (Rutland 194) that was a bit different than the universal boxcar but probably not inconsistent with Gilbert-Nelson within my sampling statistics or their uncertainties.  

4)  Why would a ship calling at Milwaukee unload cargo for such a wide geographic spread?  Did ports such as Chicago and Milwaukee act as hubs so that the entire cargo could be unloaded at one destination and fan out by rail to avoid having the ship make multiple stops?

Ports did act as hubs, even prior to containerization and multimodal transport.  

Economic geographers call the area that a port serves its "hinterland".  In the 1950s they were often hired as consultants by ports to try to figure ways to a) define, and b) increase a port's hinterland.  Each port was eager to show that it had a bright future and an increase in traffic that would justify past and future investment.  

In practice, before containerization, port time and cost was choking off break bulk foreign export (Levinson, 2006, "The Box" is about the container shipment revolution that started in 1956).  The following table from that book shows the estimated cost of shipping one truckload of medicine from Chicago to Nancy, France in 1960 through an east coast port:  


ItemCash OutlayPercent of Cost
Rail Freight to US Port City34114.3%
Local Truck Freight in Port Vicinity954.0%
Total Port Cost116348.7%
Ocean Shipping58124.4%
European Inland Freight2068.6%


Grand Total2386100.00%

Over half the cost of the shipment was incurred in the east coast port city.  The rail freight, while not negligible, was clearly not the driving factor.  Smaller ports with newer and more efficient processes for unloading (such as Transit Shed 1 after it was refurbished in 1954) could effect a big decrease in overall shipping costs even if the ship did have to sail into the Great Lakes.  There was a strong financial incentive to discharge the cargo all at once and then transfer it to truck or rail as quickly as possible.  

The same incentives were in place for exporting.  In 1960, the Port of Milwaukee exported freight on 294 sailings.  The exports came from 210 cities in 22 U.S. states and 3 Canadian provinces.  About a third of the cities were in Wisconsin, but California, Alabama, Washington, Maryland, Massachusetts all exported through Milwaukee.  

In 1954, a government-sponsored study looked in detail at cargo loaded on the SS Warrior, and ordinary C-2 cargo ship on a sailing from Brooklyn NY to Bremerhaven Germany.  There were over 194,000 items of cargo consigned on this sailing that totaled 5,015 tons.  The commodities arrived in Brooklyn in 1,156 separate shipments from 151 different U.S. cities.  The first shipment arrived in Brooklyn more than a month before the Warrior sailed.  It took over 6 calendar days to load (with one 8 hour shift per day). The total cost of moving the Warrior's cargo on this sailing was about $240,000.  The ocean shipping accounted for about 11% of the total, while cargo handling at both ends amounted to about 40% of the total (the researchers noted that German longshoremen were only paid one fifth the rate of U.S. longshoremen at the time).  

Charles Hostetler
Goshen, Ind.  

NKP 765

$
0
0
I took these photos of NKP 765 on the south side of Goshen Ind. about 1:30 pm as she steamed up from Warsaw north to Elkhart.  View is to the southeast on an overcast day.  This is the first time I really every tried "rail fan" photography and I had a fun time.  Comments welcome, and I can send high quality (but large, >10Mb) versions to anyone interested.  Comments also welcome; I am trying to learn about prototype photography.  (click on each to enlarge)


Charles Hostetler
Goshen, Ind.

Vendome Tank Car Co. - Where Did They Make Deliveries?

$
0
0
In STMFC 123938, Bill Welch wrote:  "I am trying to make a decision about how to decal one of my Southern Car & Foundry's Standard Steel Car model. One option is a car for the Vendome Tank Car Company based in Oklahoma. I assume  this company served that states oil companies, something I know very little about. Can someone offer some wisdom in terms of where these cars cars would have been making deliveries?"

In the absence of a comprehensive set of documentary evidence to address the Vendome tank car distribution problem, I am aware of two possible approaches.  The first (which I will pursue in this post) is an associational method.  We'll pull the string on potential shippers and consignees that may have been associated with Vendome and see if we can find any patterns.  I used this sort of approach to associate UTLX tank cars with shipments from the Standard Oil bulk tank farm on Jones Island in Milwaukee to Standard bulk distribution plants in other locations in Wisconsin.  The second is a geostatistical approach (which will be discussed in the next post) in which we'll look at the distributions of shipments of refined petroleum products from Oklahoma, Kansas, and Texas to other states.  

There's not very much available online or in print to support the associational method.  This link is to two photos of VENX 173 and 519:

http://www.protocraft.com/category.cfm?ItemID=308&Categoryid=22

Both of these photos are also in Culotta (2006).  VENX 173 can be found on page 40 and the caption says the photo was taken on July 13, 1957 in Pocatello Idaho.  VENX 519 is on page 103 and the caption says that the photo was taken November 2, 1955 in Los Angeles California.  This photo shows VENX 524 and 544 but the location is unknown:

http://www.steamerafreightcars.com/gallery/tank/venx544524main.html

Mike Brock (STMFC 804) lists cars from a UP conductor's book in a westbound train on March 19, 1949 that include VENX 255 loaded with diesel fuel consigned to Pocatello Idaho.

There are also the basic data from the ORER (I used the January 1953 and the January 1958 editions).  This is a summary of information in Vendome's listing in the Private Car Owners section where the smaller owners are listed:


Item19521957
Reporting MarksV.E.N.X.V.E.N.X.

A.G.C.X.A.G.C.X.
Total Cars364416
Home PointsEl Dorado, Kan.El Dorado, Kan.

Tulsa, Okla.Tulsa, Okla.


Milton, Pa.
Noticesowner (non-shipper)owner (non-shipper)

MovementsMovements

MileageMileage

Bills for RepairsBills for Repairs

RemittancesRemittances
Address313 Braniff Bldg.314 Braniff Bldg.

Tulsa 3, Okla.Tulsa 3, Okla.

We see that Vendome used two different reporting marks, but the almost all of Vendome's cars in both time frames were registered under VENX.  Their car fleet grew by about 15% over the 5-year span, mostly through the addition of TPI's (probably for shipping LPG).  The bulk of the fleet (about 320 TMs) was basically stable over the time frame.  

Vendome's offices were in the Braniff Building in downtown Tulsa, which was an ordinary multistory office building with no particular connection to any rail line.  This seems reasonable because Vendome was listed as the owner of the cars but not the shipper.  Their particular line of business was to buy tank cars and lease them to shippers, and typically these lessors got a monthly rental fee for each car and a cut of the mileage, while the shipper managed the day-to-day operations of the fleet (see discussion under Private Car Service in the Freight Traffic Red Book for example).   

Because Vendome was a car leasing company, it's interests and operations were a step disconnected from the actual shipping and handling of commodities that were shipped in the car.  Vendome can be contrasted with Deep Rock Refining Co., for example.  Deep Rock was also a private car owner with a small fleet of cars but they were listed in the ORER as "owner (shipper)".  So for Deep Rock, we could use city directories to find their distribution network (refineries from which they shipped and their local bulk distribution terminals), but we can't take that approach for Vendome.  

The Home Points are designated places that cars can be sent for repairs or maintenance without affecting privately-owned car's mileage accounts (Freight Traffic Red Book).  Vendome's Home Points suggest that they used the American Car & Foundry Co.'s facility in Milton Pa. for major repairs and Anderson Tank Cleaning in El Dorado and Railway Tank Car Service Inc. in Tulsa (both found under the listing "Tank Car Cleaners" in their respective city directories) for maintenance.  This further suggests that the Vendome cars were associated with refined petroleum products (rather than cotton oil or linseed oil for example).  Both El Dorado and Tulsa had major refineries with multiple shippers, so as a working hypothesis it seems reasonable to believe that Vendome leased to one or more of the shippers in these areas.  

In 1953 and 1957 VENX rostered about 320 ordinary TM tank cars, mostly 8,000 gallon capacity classified ARA III, with a few 10,000-gallon cars, some ARA II cars, and some ICC 103 cars mixed in.  {The ARA III class specification was superseded by ICC 103 in 1927 (Kline and Culotta, 2006) but a number of ORER listings in the 1950s continued with the ARA III designation.}  The ORER notes indicate that one car (VENX 128) was a three-compartment car and many of the TM cars were equipped with steam heating coils.  A quick check of the commodity table in the back of Kaminski (2003) shows that a fleet of ICC 103 (or ARA III) cars is suitable for shipping the commodities that are produced by refineries:

CommodityICC 103ICC CC
GasolineCommonly used depending on V.P.501
Petroleum OilCommonly used depending on V.P.503
Bunker OilCommonly used503
Petroleum DistillateCommonly used depending on V.P.503
WaxesCommonly used503
GreaseCommonly used505
BenzineCommonly used depending on V.P.507
NapthaCommonly used depending on V.P.507
PentaneCommonly used depending on V.P.507
Road Asphalt or TarCommonly used depending on V.P.339

(In this table, the third column shows the ICC Commodity Class that contains the commodity which we will refer to later on in the discussion.)

Starting in 1928, the Bureau of Mines published annual reports of the petroleum refineries and cracking plants operating in the United States.  In 1957, there were two refineries operating in El Dorado and two in Tulsa:

RefineryTypeCOCCGC
El Dorado Kan.


El Dorado Refining Co.S-C-A18,3006,250
Skelly Oil Co.S-C-A45,00019,000


Kansas Total
307,500129,725


Tulsa Okla.


D-X Sunray Oil Co.S-C-L74,00021,000
The Texas Co.S-C39,00022,500


Oklahoma Total
386,050141,530
(S-C-A refineries produce diesel, gasoline, and asphalt; S-C-L refineries produce diesel, gasoline, and lubricants; and S-C refineries produce diesel and gasoline.  COC is the crude oil capacity of the refinery and CGC is the cracked gasoline capacity.  Both figures are in average daily maximum capacities in barrels.)

It is important to realize that the refinery owner is not necessarily the shipper of all (or even the majority) of the refined product.  Typically, a number of oil distributors, jobbers, and shippers bought some of the refineries output and arranged shipping from the refinery to individual customers.  El Dorado Refining Co., for example, was an independent refinery that sold all of its output on the open market and did not have its own distribution/retail network.  

 The table below was taken from late 1950s-era City Directories and contains some of the shippers and distributors in El Dorado, Tulsa, and Pocatello.  This table is illustrative, not complete, particularly for Tulsa where there were four pages of shippers that supported the distribution of refined petroleum products from the two refineries.  I've made some notes in the right-hand column in cases where a shipper was known to have tank cars of its own (from the Jan., 1958 ORER):

StationShipperTank Cars?
El Dorado Kan.Beaumont Petroleum Co.

LM Burns Co.

Franco Central Oil Co.

Theo Helling

K-T Oil Corp.

CH Lindenbaum

Magnolia Petroleum Co.owner (shipper), MPCX, 699 cars, mostly TM ARA III

Molk Petroleum

Saco Oil Co.

Skelly Oil Co.

Wilson Oil Co.


Tulsa Okla.Alexander Oil Co.

Anchor Petroleum Co.owner (shipper), ANPX, 400 cars, only 5 TM ARA II/III

Bates-Reading Oil Corp.

D-X Sunray Oil Co.owner (shipper), SRDX, COSX, OSKX, 1097 cars, mostly TMs

Four States Oil & Gas Co.

Gulf Oil Corp.owner (shipper), GRCX, 1484 cars, mostly TM

Kewanee Oil Co.

Major Oil Co.

Midstates Oil Corp.

Ohio Oil Co.

Pan-American Petroleum Corp.

Pure Oil Co.

Rocket Oil & Gas Co.

Shell Oil Co.

Sinclair Refining Co.SDRX cars operated by Union Tank Car Co.

The Texas Co.TCX cars operated by General American Transportation Corp.

Union Oil Co. of CaliforniaUOCX cars operated by General American Transportation Corp.

Wilcox Oil Co.owner (shipper), HWX, 8 cars, all TMI

Wood Oil Co.


Pocotello Ida.American Oil Co.

Continental Oil Co.

Golob Oil Co. Inc.

Hardy Coal & Oil Co. (Union 76 Distributors)

MJ Hodkins

Idaho Oil Co.

HO Miller Co. (Phillips 66 Distributors)

Portneuf Co-op Association Inc.

Sinclair Refining Co.

Standard Oil Co.

The Texas Co.

Union Oil Co. of California

Westcott Oil Co.

Given the lack of information specific to the Vendome lessor's, there aren't a lot of constraints on the variety of shippers and consignees we can imagine.  We do know that the size and composition of the Vendome fleet was pretty stable, and they did stay in business for a rather long period of time.  I would speculate that a long-term leasing relationship with several of the independent oil shippers was the most likely case for Vendome, and that these independent shippers might have shipped to a variety of independent bulk distributors.  

In the next post we can take a look at the distributions of shipments of refined petroleum products from Oklahoma and Kansas and see how they changed with time during the 1950s.  

Charles Hostetler
Goshen, Ind.

Vendome Shipments - Part 2

$
0
0
In the previous post I collated some information that was consistent with the working hypotheses that:

  1. Vendome leased its tank cars to shippers of refined oil products located in the Kansas/Oklahoma/Texas area.
  2. Vendome was not itself a shipper.  
  3. The lessors of Vendome's tank cars could have been any of a number of shippers including major distributors and independents.  
In this post I want to use some of the summary statistics from the ICC's 1% Carload Waybill Survey to see if we can estimate the geographic reach and frequencies of shipments of refined petroleum products.  

The Pertinent Commodity Classes:

The ICC's 1% Waybill Survey statistics are reported by commodity classes.  We are looking for commodity classes that represent output from petroleum refineries that could be carried in ordinary TM cars classified ARA II/III or ICC 103.  The pertinent commodity classes, and the commodities that make up these classes are summarized in the following table:


Commodity Class
NumberNameContains
339AsphaltAsphalt, by-product


Asphalt, natural


Asphalt, petroleum


Gilsonite
501GasolineGasoline, blended, consisting of motor fuels containing 50% or more of gasoline


Gasoline, casinghead


Gasoline, natural


Gasoline, noibn
503Fuel, Road, and Petroleum Residual Oils, N.O.S.Carbon black oil


Diesel oil


Distillate, petroleum, noibn


Fuel oil


Fuel distillate


Gas emulsion


Gas oil


Petroleum oil distillate


Petroleum oil tank bottoms, noibn


Petroleum tailings, noibn


Residual fuel oil


Road oil


Wax tailings, petroleum
505Lubricating Oils and GreasesAxle grease, noibn


Axle grease, petroleum


Lubricants, noibn


Lubricating grease, noibn


Lubricating grease, petroleum


Lubricating oil, noibn


Lubricating oil, petroleum
507Petroleum Products, Refined, N.O.S.Absorption oil, petroleum


Belt oil, petroleum


Benzine (benzene) (benzol)


Butane gas


Compression oil, petroleum


Cordage oil, petroleum


Floor oil, petroleum


Harness oil, petroleum


Kerosene


Leather oil, petroleum


Liquified petroleum gas


Miners' oil, petroleum


Naptha


Naptha distillate


Naptha solvent, petroleum


Napthenic acid


Neatsfoot oil, petroleum


Oil, petroleum, noibn


Paraffine wax


Pentane


Petrolatum, noibn


Petroleum fatty acid


Petroleum jelly, noibn


Petroleum wax


Propane gas


Putty oil


Refined oil, petroleum, illuminating or burning


Soap oil, petroleum


Tanner's oil, petroleum


Tobacco oil, petroleum


Transformer oil, petroleum


Wool oil, petroleum

The abbreviation noibn means "not otherwise indexed by name" and N.O.S. means "Not Otherwise Specified".  That's a pretty long table, but fortunately most of it is self-explanatory.  Commodity classes 329 (asphalt), 501 (gasoline), and 505 (lubricants) contain exactly what you would expect from the name.  Commodity class 503 (fuel and road oil) contains primarily diesel fuel and home heating oil.  Commodity class 507 (Other Refined Products, which I abbreviate here as ORP) contains a mixture of solids, liquids, and gases that include (in order of decreasing quantity produced) naphtha, kerosene, liquified gases for fuel, aromatic hydrocarbons, and waxes.  Consignees for commodity class 503 were primarily local distributors of fuel and road oil.  Consignees for commodity class 507 were primarily industrial or transportation-related facilities.


Temporal Changes in National Statistics:

I looked at the statistics from the late 1940s through 1960.  I was working from the hypothesis that this period was a time of change in the patterns of rail shipments of refined petroleum products.  The factors driving change were installation of new refineries and pipelines, the trend toward motor freight, and changes in refinery operation.  

This chart shows the time series of carload shipments of refined petroleum products in the U.S. from 1947 through 1960 (click to enlarge):

The data series labeled <Comm> represents the average behavior of all commodities shipped by rail during that period.  These data suggest:
  1. Gasoline, diesel, and other refined products dominated the sample.
  2. There was a general decline in rail shipments of refinery products during the time period except for other refined products, which increased by about 25% over the 14 years.  
  3. There might have been three time periods with somewhat different characteristics; the immediate post-war years (with high frequencies of gas and diesel shipments), the early 1950s (where gas, diesel, and other refined products were about equal in frequency), and the late 1950s (where other refined products were more frequent than gas and diesel shipments).  
  4. During this time frame the minor components (asphalt and lubricants) roughly tracked the behavior of most other commodities (the blue line) showing a general decrease throughout the period.  

This graph illustrates the changes in shipping patterns over the three broad time periods and compares the shipping frequencies with an estimated average refinery output (scaled to a 15,000 carload sample):


Geographic Reach of Rail Shippers in Kansas, Oklahoma, and Texas:

One of the things I was interested in was whether the scope of the rail shipments of refinery products was primarily a local phenomena or somewhat broader in nature.  This graph shows the average line haul of national shipments of refinery products as a function of time:
These data show that line hauls for other refined products, lubricants, and asphalt (to a lesser degree) were on a multi-state regional scale, and that line hauls for gasoline and diesel shipments tended to be  much smaller, on the order of several hundred miles.  

That idea is reinforced by the next two charts, which show the distribution of line hauls for tank car shipments of three refinery commodity classes in the early 1950s and the late 1950s:

It is clear that other refined product shipments and at least some part of diesel shipments were on a regional (multi-state) scale.

I looked at the distribution of state-to-state shipments of gasoline, diesel, and ORP that originated in Kansas, Oklahoma, and Texas during the early and late 1950s.  These maps compare the geographic distribution of consignees for gasoline shipments from Kansas in the early (above) and late (below) 1950s:


Gasoline from Oklahoma in the early (above) and late (below) 1950s:


Gasoline from Texas in the early (above) and late (below) 1950s:


Diesel/fuel oil from Kansas in the early (above) and late (below) 1950s:


Diesel/fuel oil from Oklahoma in the early (above) and late (below) 1950s:


Diesel/fuel oil from Texas in the early (above) and late (below) 1950s:


Other refined products from Kansas in the early (above) and late (below) 1950s:


Other refined products from Oklahoma in the early (above) and late (below) 1950s:


Other refined products from Texas in the early (above) and late (below) 1950s:


  1. Shipments from Texas have the widest geographic scope of consignees for all three commodity classes in both the early and late 1950s, followed by Kansas and Oklahoma.  
  2. For all states, shipments of Other Refined Products (ORP) have the widest geographic scope of consignees, followed by diesel/fuel oil and gasoline.  
  3. For gasoline and diesel/fuel oil, the grain of the commodity flows trend from Kansas, Oklahoma and Texas northeast toward Illinois and Wisconsin.  For shipments originating in Texas there is also an east/west trend extending from Arizona/New Mexico toward Alabama/Georgia.  
  4. For other refined products the commodity flows cover most of the U.S.

Frequencies of Vendome Shipments:

I thought about several ways to estimate the relative frequencies of shipments of refinery products in Vendome cars.  One way to think about it is that Vendome had about 320 TM tank cars throughout the 1950s.  If these leased cars made around 15 trips each year (about the national average), then we would expect perhaps 5,000 or so Vendome tank car shipments each year.  In the early 1950s there were about 355,000 shipments of gasoline, diesel/fuel oil, and ORP from Kansas, Oklahoma, and Texas (and about 295,000 shipments in the late 1950s).  So on the average, one out of every 70 (early 50s) to 60 (late 50s) shipments of petroleum products from Kansas, Oklahoma, or Texas might be expected to come in Vendome cars.  This is not an unreasonably small traffic flow to model over the course of 10 or so operating sessions.  

In looking at the statistics from the Ahnapee & Western waybill collection, it seems that at least in the early 1960s on the A&W that shipments seemed to come in clumps or clusters of similar cars from similar shippers.  These traffic lanes seem to have their basis in corporate relationships between suppliers, distributors, and end users.  If one is willing to postulate a relationship between Vendome's lessee (the shipper) and a local bulk gasoline/fuel oil distributor or a local industry that uses kerosene or naphtha as an input, then it seems to me that having a steady trickle of Vendome cars through the layout could be quite plausible, particularly in the upper midwest, southwest, and gulf coast.

Originating Line Haul Carriers:

If you are using prototype-based waybills the originating line haul carriers are of interest.

In El Dorado, both the El Dorado Refining Co. and Skelly Oil Co. refineries were served directly by the Santa Fe.  If there was a local switching agreement, then the Missouri Pacific, the other carrier in El Dorado, could have been an originating carrier as well.

In Tulsa, the D-X Sunray Oil Co. and Texas Co. refineries were directly served by the St. Louis - San Francisco.  Depending on local switching agreements, other line haul carriers in Tulsa that could originate shipments were the ATSF, MKT, and Midland Valley.  

Charles Hostetler
Goshen, Ind.

Viewing all 116 articles
Browse latest View live